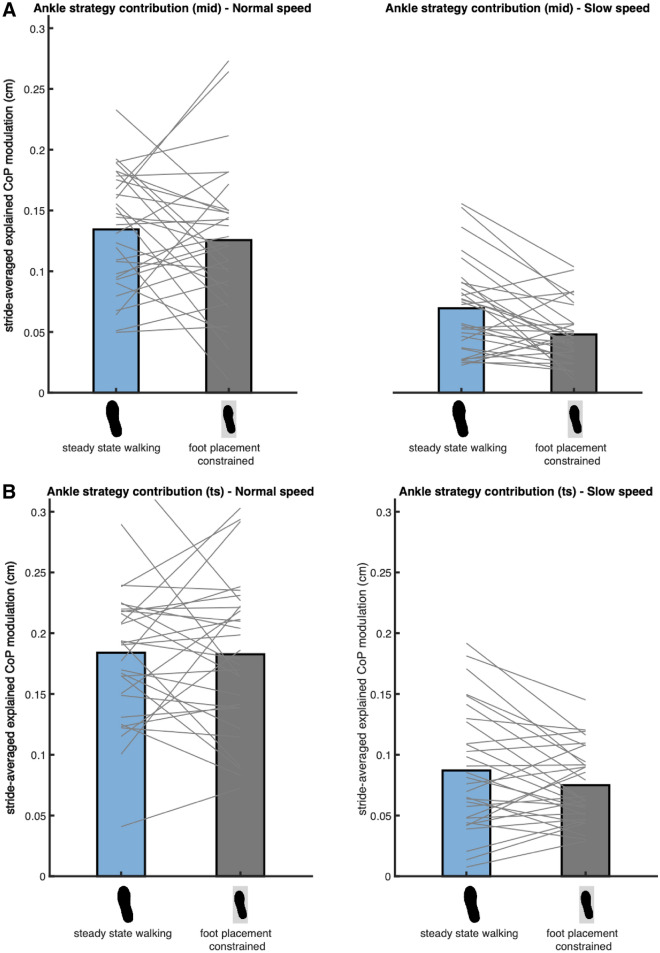
Figure 7.
Mean absolute explained variance of the ankle strategy model (2). For normal (left) and slow (right) walking speeds panels A and B depict respectively the absolute explained variances for the foot placement error at mid- and terminal swing. Blue and grey bars represent the steady-state walking and foot placement constrained conditions respectively. In this figure the absolute explained variance is expressed as the square root of the stride averaged explained variance, as a reflection of the magnitude of the average explained CoP shift in centimeters. The grey lines connect individual data points. As the best model did not include the factor Condition, no Bayes factors have been presented. This figure was created using Matlab 2021a (https://www.mathworks.com/products/matlab.html) and Adobe Illustrator CC 2018 (https://www.adobe.com/nl/products/illustrator.html).

