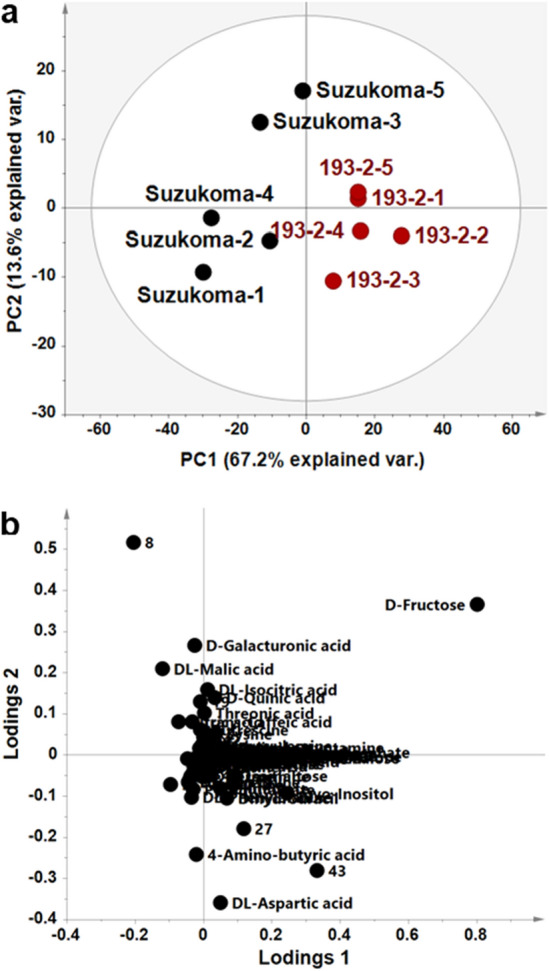
Figure 6.

Principal component analysis (PCA) of metabolites in mature fruits from the SlINVINH1 genome edited line. Metabolite levels in mature fruits obtained from original cultivar ‘Suzukoma’ and the SlINVINH1 genome edited line (193–3) were determined by GC-TOF/MS. (a) Score scatter plot of the PCA. Black symbol indicates ‘Suzukoma’ and red symbol indicate the SlINVINH1 genome edited lines (n = 5 for each sample). (b) Loading scatter plot of the PCA analysis (n = 148 metabolite peaks). Numbers indicate unknown peak of metabolites.
