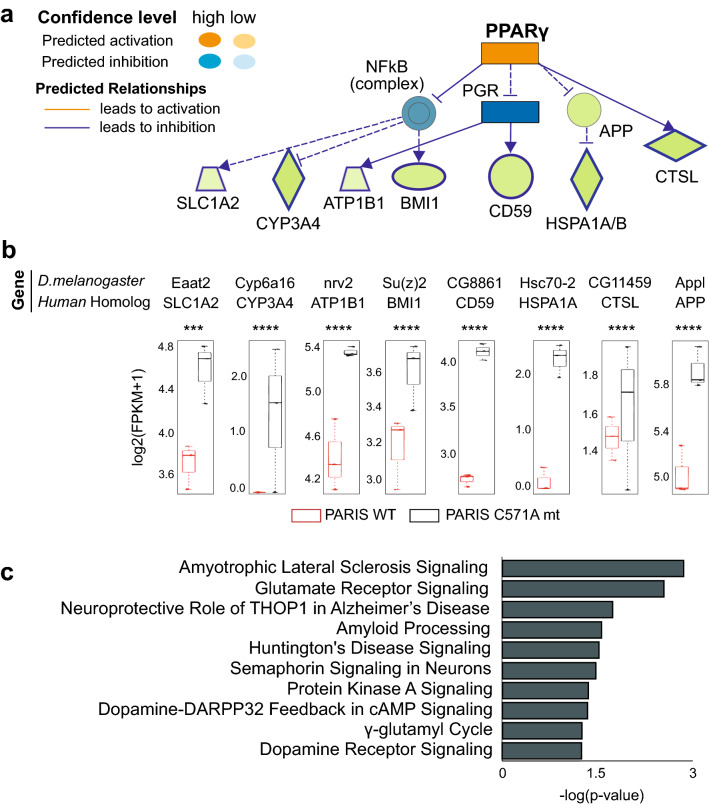
Figure 3 .
Multifactorial transcriptomic changes induced by PARIS identify PPARγ as a master regulator. (a) The PPARγ network enriched in the input dataset (i.e. human orthologs of the DEGs identified as downregulated from “PARIS C571A mutant versus PARIS wild type” comparison) using Causal Network Analysis (CNA) tool in IPA34. Blue arrows indicate a direct, suppressive relationship (such as causation, phosphorylation, and so on) while dashed arrows indicate an indirect relationship. Blue dashed lines without arrow indicate an indirect inhibition, likely by ubiquitination. Green nodes represent user-supplied genes (that is, downregulated in PARIS wild type) while the other nodes are predicted genes. Dark blue shading means the node is predicted to be inhibited by its regulator with high confidence (such as PGR) while pale blue shading means inhibitory prediction with low confidence (such as NFkB). Network shapes: rectangle (nuclear receptor), vertical diamond (enzyme), horizontal diamond (peptidase), ellipsis (transcription regulator), trapezoid (transporter), circle (other). Enrichment (FET) p value threshold: 1e−03. (b) The expression profile of the user-supplied genes in the PPARγ network in (A) with statistical significance values: ***p ≤ 0.001, ****p ≤ 0.0001. As expected, all these genes with plotted expression profiles are downregulated with high significance in PARIS wild type with respect to the mutant. (c) Enriched canonical pathways with a strong emphasis on neurodegeneration identified by Canonical Pathway Analysis (CPA) module in IPA34 taking the same human ortholog genes in (A) as input.

