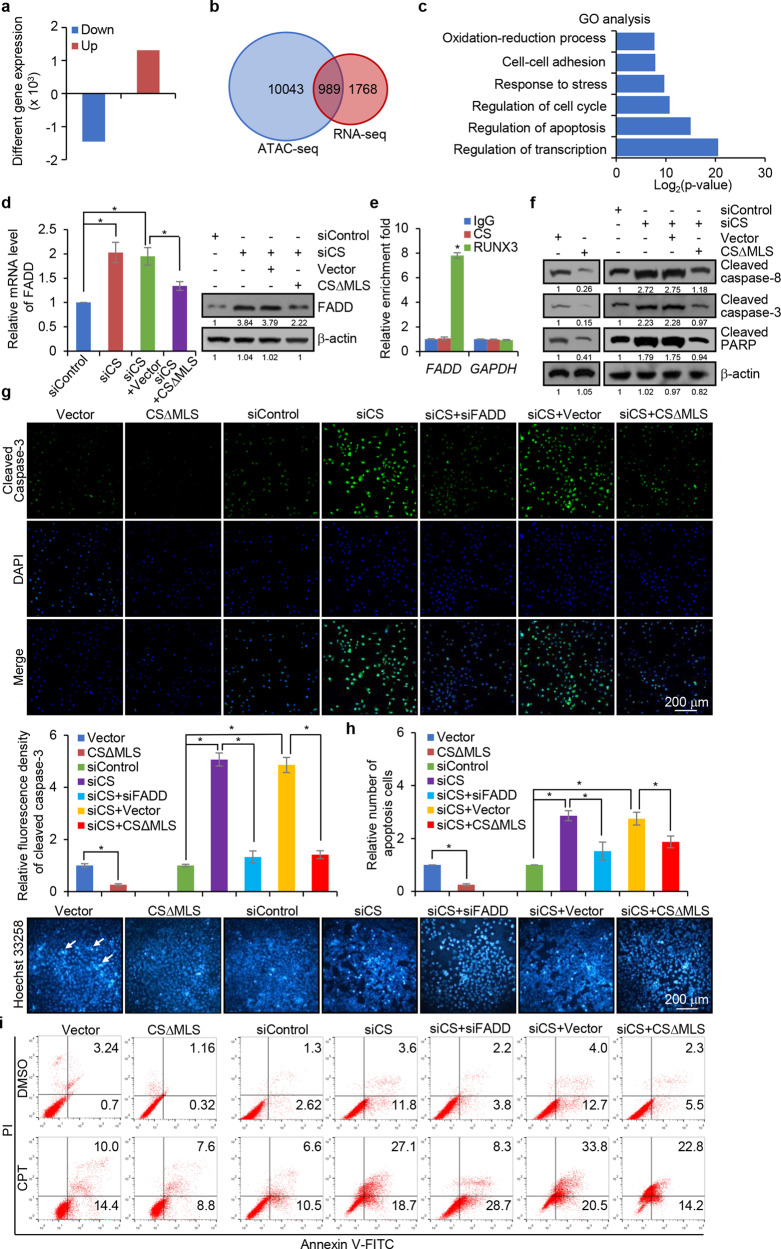
Fig. 6.
The nTCA cycle is functionally linked to transcription regulation and cellular activities. a RNA-seq analysis of differentially expressed genes in CS-depleted HepG2 cells. b Venn diagram for cross-analysis of ATAC-seq and RNA-seq in CS-deficient HepG2 cells. c Ontology analysis of genes regulated by CS depletion in HepG2 cells. d HepG2 cells were transfected with CS siRNA and/or CS∆MLS for analysis of FADD expression by qRT-PCR and western blotting. Error bars represent mean ± SD for triplicate experiments (*p < 0.05). e qChIP analysis of FADD and GAPDH promoter occupancy by CS or RUNX3 in HepG2 cells. Error bars represent mean ± SD for triplicate experiments (*p < 0.05). f HepG2 cells were transfected with CS∆MLS or/and CS siRNA followed by treatment with CPT for 48 h for western blotting analysis with antibodies against cleaved caspase-8, caspase-3, and PARP. g HepG2 cells were transfected with CS∆MLS or/and CS siRNA or FADD siRNA followed by treatment with CPT for 48 h for immunofluorescent staining with antibodies against cleaved caspase-3 (green). DAPI staining was included to visualize the nucleus (blue). Bar, 200 μm. The relative fluorescent intensity of cleaved caspase-3 was quantified by Image J software. Error bars represent mean ± SD for triplicate experiments (*p < 0.05). h HepG2 cells were transfected with CS∆MLS or/and CS siRNA or FADD siRNA followed by treatment with CPT for 48 h for Hoechst 33258 staining and analysis by fluorescence microscopy. The arrows indicate the apoptotic bodies. Bar, 200 μm. i HepG2 cells were transfected with CS∆MLS or/and CS siRNA or FADD siRNA followed by treatment with CPT for 48 h for Annexin V-FITC/PI staining and flow cytometry

