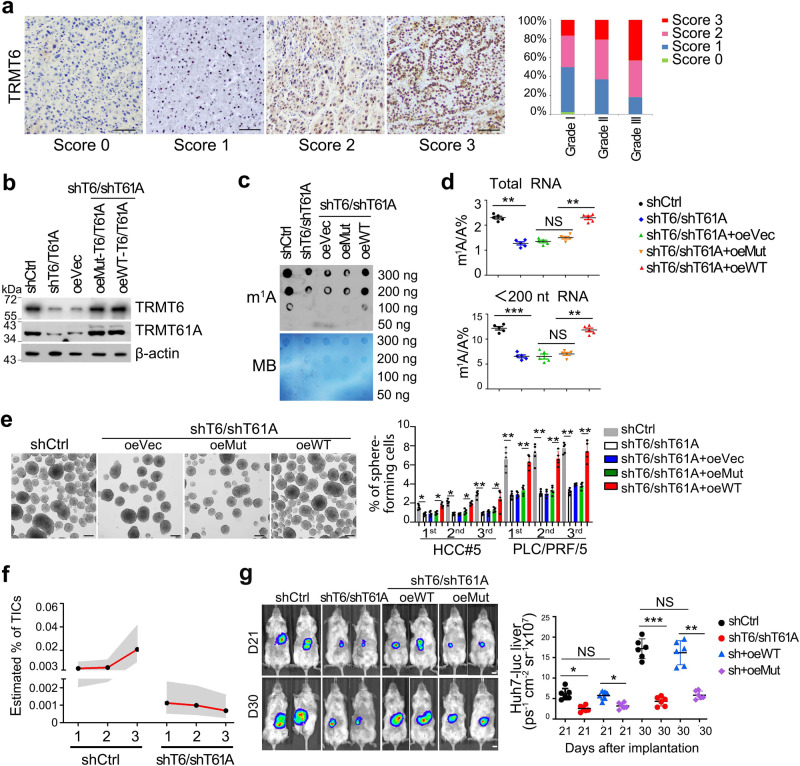
Fig. 2. TRMT6/TRMT61A-mediated m1A modification drives self-renewal of liver CSCs and tumourigenesis.
a Representative immunohistochemistry images of TRMT6 protein levels (brown) in the cohort of 191 HCC samples. n = 3 independent experiments. Score 0 (0–5% positive cells/tissue section) represents TRMT6 staining that is considered negative; score 1 (5–15% positive cells/section) represents TRMT6 staining that is considered week positive, whereas scores 2 (15–35% positive cells/section) and 3 (>35% positive cells/section) represent TRMT6 staining that is considered positive. Grade I (n = 56), Grade II (n = 87), Grade III (n = 48). Scale bar, 100 μm. b Western blotting confirmation of TRMT6/TRMT61A (T6/T61A) depletion, and co-infection of WT or TRMT6R377L/TRMT61AD181A (Mut) constructs in TRMT6/TRMT61A depleted cells. These experiments were repeated three times. oe overexpression, Vec vector. n = 3 biologically independent samples. c Global m1A levels were detected in shCtrl, TRMT6/TRMT61A depletion, and co-infection of WT or Mut-TRMT6/TRMT61A in TRMT6/TRMT61A depleted liver CSCs using dot blot assay. Data were repeated five times. n = 5 biologically independent samples. d LC-MS/MS quantification of m1A levels in total RNA and tRNA (<200 nt) purified from indicated liver CSCs, presented as percentage of unmodified A. Data are means ± SD. n = 5 biologically independent samples. Exact P values from left to right (upper): 0.0033, 0.052, 0.0087; left to right (lower): 0.00012, 0.22, and 0.0084. e TRMT6/TRMT61A depletion suppressed serial oncosphere-forming capacity in HCC primary cells and HCC cell lines. Right panel represents statistical results as means ± SD. n = 5 biologically independent cells. Scale bar, 100 μm. Exact P values from left to right: 0.036, 0.029, 0.031, 0.042, 0.0031, 0.022, 0.0022, 0.0054, 0.0063, 0.0072, 0.0050, 0.0064. f Estimated frequency of tumor initiating cells (TICs) in TRMT6/TRMT61A depleted and control liver CSCs during serial transplantations in NSG mice. Data are presented as mean values (black spot) and upper/lower values (gray area). n = 10 mice per group. g Four kinds of knockdown and rescued Huh7 CSCs with green fluorescent protein (GFP)–luciferase tags (Huh7-Luc) were orthotopically implanted into NSG mice. HCC tumor growth rates of with orthotopic engraftment were monitored in vivo by whole NSG mouse imaging after 21 and 30 days post-transplantation, respectively. Scale bar, 1 cm. Right panel represents statistical results as means ± SD. n = 6 mice per group. Exact P values from left to right: 0.023, 0.064, 0.040, 0.00071, 0.053, 0.0085. *P < 0.05; **P < 0.01; ***P < 0.001, and NS not significant (P > 0.05) by two-tailed Student’s t-test.

