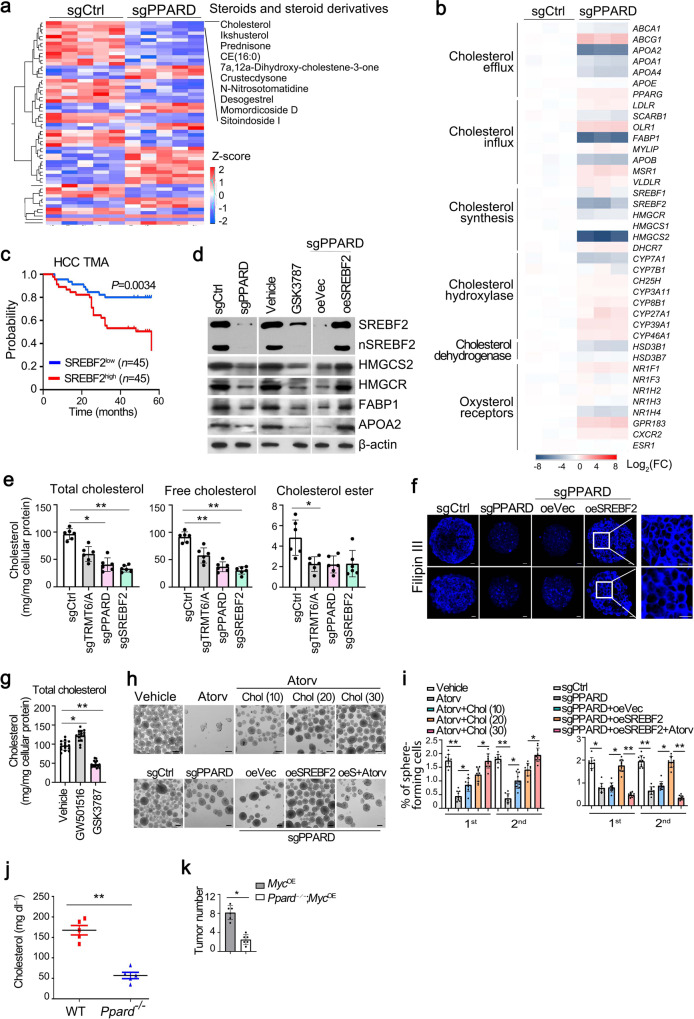
Fig. 4. PPARδ promotes liver CSC self-renewal via enhancing cholesterol synthesis.
a Heatmap analysis of signature molecules of steroid metabolites under positive ion mode in PPARδ depleted versus sgCtrl treated liver CSC cells. b Heatmap analysis of cholesterol metabolism related genes in PPARδ-depleted and control CSCs. Data were normalized to endogenous 18S rRNA expression and sgCtrl were assigned with a value of 1. c Kaplan–Meier plots of overall survival for SREBF2 in TMA cohort. Median expression value was used as a cut-off. P values for Kaplan–Meier curve were determined using a two-sided log-rank test. d Western blotting analysis of cholesterol metabolism related gene expression in PPARδ depleted, GSK3787 (20 μM) treated and SREBF2 overexpressed liver CSCs compared with control CSCs. n = 3 biologically independent samples. e Levels of total cholesterol, free cholesterol and cholesterol esterin TRMT6/TRMT61A, PPARδ, and SREBF2 depleted liver CSCs. Data are means ± SD. n = 6. Exact P values from left to right: 0.037, 0.0061, 0.0070, 0.0032, 0.046. f Filipin III staining of cellular cholesterol distributions in PPARδ depleted, and co-transfection of SREBF2 in PPARδ depleted liver CSCs from two HCC patients compared with control CSCs (n = 5). Scale bar, 10 μm. n = 3 biologically independent samples. g Total cholesterol levels in liver CSCs treated with vehicle (DMSO), PPARδ antagonist (GSK3787, 20 μM) or agonist (GW501516, 20 μM) for 72 h. Data are means ± SD. Exact P values from left to right: 0.041, 0.0073. CSCs were sorted from HCC patients, n = 15. h, i Representative images of oncosphere formation analysis from liver CSCs treated with vehicle, cholesterol synthesis inhibitor atorvastatin (atorv, HMGCR inhibitor, 5 μM), cholesterol (20, 30, and 40 μM) (upper panel) (h). Oncosphere formation analysis of PPARδ-depleted spheres treated with overexpression of SREBF2, coupling with atorvastatin (atorv) (lower panel) (i). Scale bar, 100 μm. Liver CSCs were sorted from HCC primary samples, n = 10. Data are means ± SD. Exact P values from left to right: 0.0032, 0.047, 0.046, 0.0019, 0.026, 0.038; 0.026, 0.037, 0.0065, 0.0091, 0.043, 0.0029. j Total serum cholesterol levels in 10-week-old normal-fed male MycOE mice transduced with sgPpard using CRISPR/Cas9 strategy for 10 days (Ppard−/−; MycOE). WT:Ppard+/+; MycOE. Data are means ± SD. n = 5 mice per group. Exact P value: 0.0073. These experiments were repeated three times. k Tumor numbers from Ppard+/+; MycOE and Ppard-/-; MycOE mice. Data are shown as means ± SD (n = 6 mice per group). Exact P value: 0.033. *P < 0.05; **P < 0.01 by two-tailed Student’s t-test.

