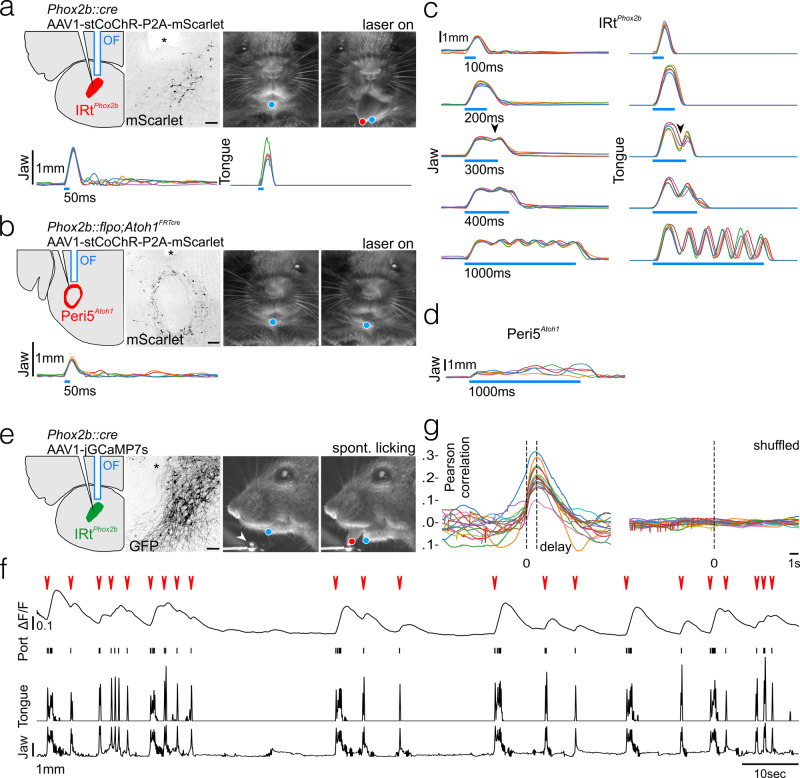
Fig. 4. Orofacial movements triggered by IRtPhox2b and Peri5Atoh1 and activity of IRtPhox2b during voluntary licking.
a (Upper left) Schematic of the viral injection and fiber-optic implantation for stimulation of IRtPhox2b, and transverse section through the hindbrain showing transduced IRtPhox2b neurons and position of optical fiber (OF, asterisk); scale bar 100 μm. (Upper right) Example frames of the mouse face before and during stimulation including DeepLabCut tracked position of the jaw (blue) and tongue (red). (Lower) Individual traces of tracked jaw and tongue position on the Y-axis upon 50 ms stimulation (five trials). b (Upper left) Schematic of the viral injection and fiber-optic implantation for stimulation of Peri5Atoh1 and transverse section through the hindbrain showing transduced Peri5Atoh1 neurons and position of optical fiber (asterisk); scale bar 200 μm. (Upper right) Example frames of the mouse face before and during stimulation including DeepLabCut tracked position of jaw (blue). (Lower) Individual traces (five trials) of tracked jaw position on the Y-axis upon 50 ms stimulation. c Individual traces (five trials) of the tracked jaw (left) and tongue (right) position on the Y-axis upon stimulation of IRtPhox2b of increasing length. A repetitive movement is triggered by stimulation beyond 300 ms (arrowhead). d Individual traces (five trials) of tracked jaw position on the Y-axis upon a 1000 ms stimulation of Peri5Atoh1. The jaw remains open and quivers non-rhythmically during the stimulus. e (Left) Schematic of viral injection and optical fiber implantation for observation of IRtPhox2b activity, and transverse section through the hindbrain showing transduced IRtPhox2b neurons and position of optical fiber (asterisk); scale bar 100 μm. (Right) Example frames of the mouse face before and during a bout of licking from a lick port (arrowhead), during a photometry recording, including DeepLabCut tracked position of the jaw (blue) and tongue (red). f Example trace of change in bulk fluorescence of IRtPhox2b during a recording session (∼2 min) of unitary licking events and licking bouts (red arrowheads), contact events with the lick port, and movements of the tongue and the jaw on the Y-axis. g (left) Superimposed correlation curves between licking activity and calcium activity (each curve corresponding to one of 15 recording sessions, each 1–5 min, in one mouse) which peaked at 1.2 s after lick port contact; (right) no peak was observed after shuffling the data.

