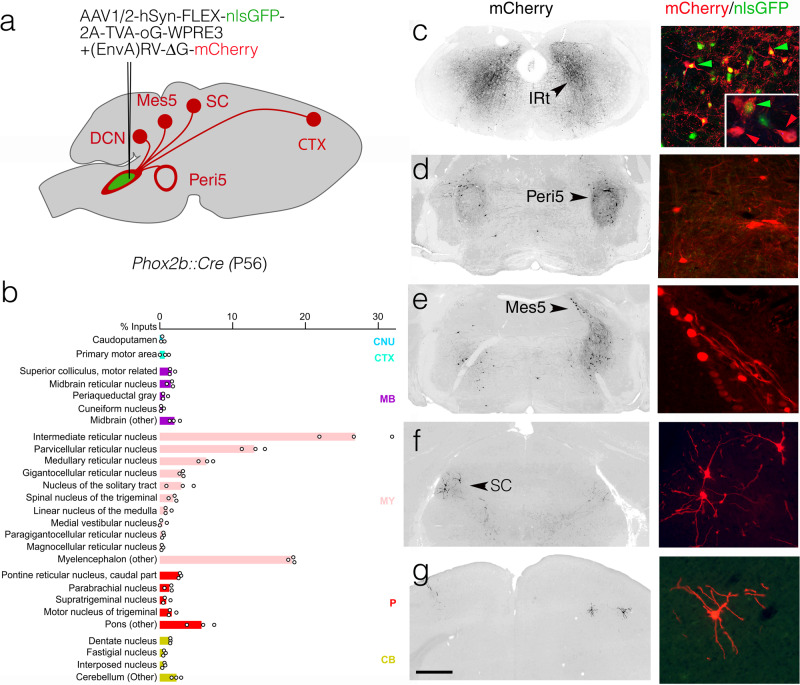
Fig. 5. Inputs to IRtPhox2b.
a Strategy for the retrograde transsynaptic labeling of input neurons to IRtPhox2b with exemplar sites of input. b Bar graph of the relative percentage of monosynaptic input neurons labeled from IRtPhox2b starter neurons, displayed per brain region as defined in the Allen Brain Atlas (n = 4063 input cells and n = 598 starter cells, from n = 3 animals; individual values as circles; seeding efficiency = 7.4 inputs/starters ± 1.8 SEM). Rabies labeled input neurons were largely (74.5 ± 1.1% SEM) restricted to the medulla (pink, MY) and exhibited a slight but consistent ipsilateral bias (55.6 ± 3.0% SEM). Major sources of these medullary inputs were the intermediate, gigantocellular, and parvocellular reticular nuclei. Inputs from the cortex, midbrain, and pons represented a minority of rabies-labeled neurons (1.6 ± 0.3% SEM, 6.4 ± 0.5% SEM, and 12.3 ± 1.1% SEM respectively). c–g Images at low magnification (left) and high magnification (right) of monosynaptic input neurons in the IRt, Peri5, mesencephalic nucleus of the trigeminal nerve, contralateral superior colliculus, and motor cortex. Green arrowheads: seed neurons; red arrowheads: (n-1) IRt neurons. CB cerebellum, CNU caudoputamen, CTX cortex, DCN deep cerebellar nucleus, MB midbrain, Mes5 mesencephalic nucleus of the trigeminal nerve, MY myelencephalon, P pons, SC superior colliculus. Scale bar c–g 1 mm.

