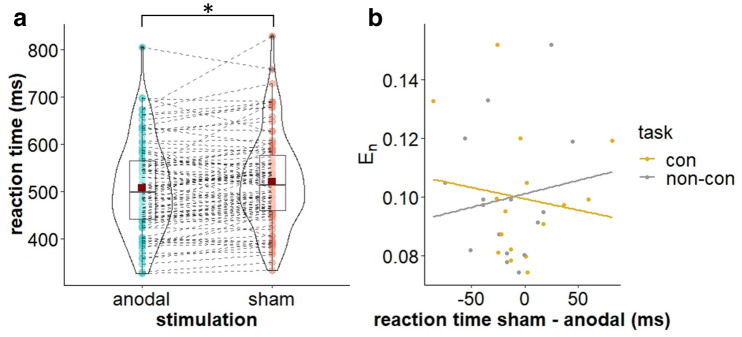
Figure 5.
Stimulation effects on Flanker performance. (a) Violin plot for mean (± SD) and individual Flanker RT for sham and multichannel stimulation, averaged over concurrent and non-concurrent task condition. Red squares indicate mean RT, coloured dots indicate individual RT (*p < 0.05). (b) Scatter plots with regression lines of stimulation effect (sham-anodal) on Flanker RT and individual normal E-field component (En) for concurrent (con) and non-concurrent (non-con) task condition.

