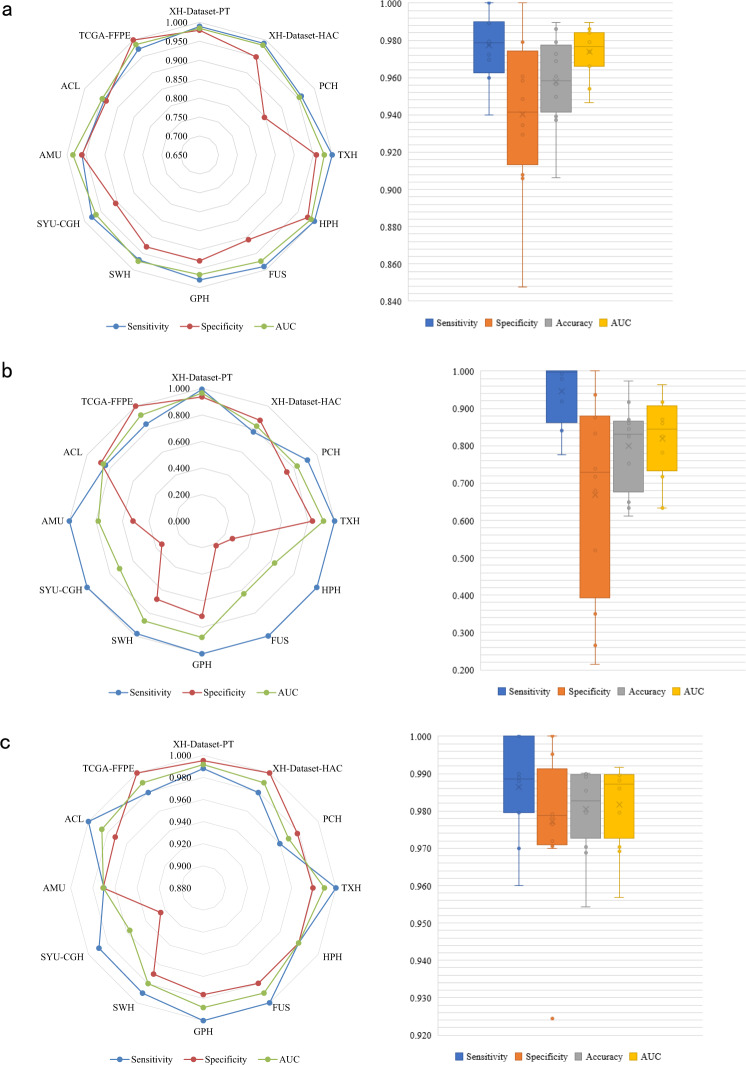
Fig. 3. The results of patient-level CRC recognition.
Patient-level comparison of a Model-10%-SSL, b Model-10%-SL, and c Model-70%-SL on 12 independent data sets from Dataset-PT. Left: Radar maps illustrate the sensitivity, specificity, and area under the curve (AUC) of three models on 12 centers. Right: Boxplots show the distribution of sensitivity, specificity, accuracy, and AUC of the three models in these centers. The boxes indicate the upper and lower quartile values, and the whiskers indicate the minima and maxima values. The horizontal bar in the box indicates the median, while the cross indicates the mean. The circles represent data points, and the scatter dots indicate outliers. The average AUC and standard deviation (sample size = 12) are calculated for each model, and the Wilcoxon-signed rank test (sample size/group = 12) is then used to evaluate the significant difference of AUCs between two models. Two-sided P values are reported, and no adjustment is made. Model-10%-SSL vs. Model-10%-SL: AUC: 0.974 ± 0.013 vs. 0.819 ± 0.104, P value = 0.002; Model-10%-SSL vs. Model-70%-SL: 0.974 ± 0.013 vs. 0.980 ± 0.010, P value = 0.117. The data points are listed in Supplementary Data 1.

