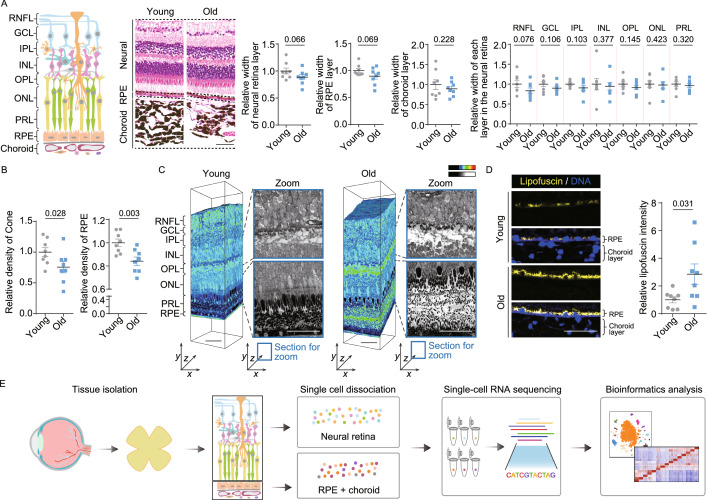
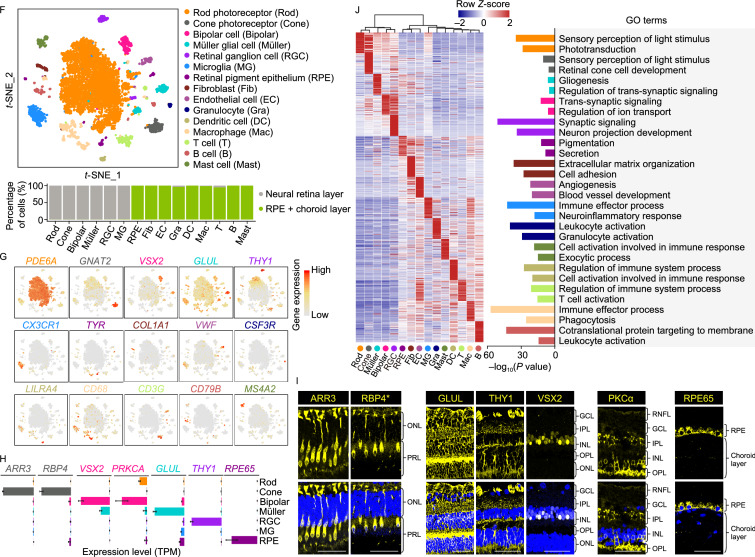
Figure 1.
Establishment of cynomolgus monkey single-cell transcriptome landscape of retinal and choroidal cells. (A) Left, diagram showing the histological structure of monkey retina and choroid. Middle, representative images of H&E-stained sections of retinal and choroidal tissues from young and old monkeys. Right, the quantitative data for the relative width of each layer are shown as the mean ± SEM. Scale bar, 50 μm. Young, n = 8 monkeys; old, n = 8 monkeys. One-tailed student’s t-test P values are indicated. (B) The relative density of Cone and RPE cells are shown as the mean ± SEM. Young, n = 8 monkeys; old, n = 8 monkeys. One-tailed student’s t-test P values are indicated. (C) Large-scale three-dimensional reconstruction of a rectangular piece of retina using automatic collector of ultrathin sections scanning electron microscopy (AutoCUTS-SEM). Left, volume electron microscopy; right, the zoomed sections selected from the position of coordinate axes labeled with blue rectangles; the enlarged areas are indicated by black dash lines and shown without coloring with Imaris9.2.1 (color-key). Scale bar, 50 μm. (D) Representative images of lipofuscin accumulation in RPE are shown on the left, and quantitative data are shown as the mean ± SEM on the right. Scale bar, 50 μm. Young, n = 8 monkeys; old, n = 8 monkeys. Two-tailed Student’s t-test P value is indicated. (E) Study flowchart of single-cell RNA-seq in this study. (F) Top, t-SNE plot showing different cell types. Rod, rod photoreceptors; Cone, cone photoreceptors; Bipolar, bipolar cells; Müller, Müller glial cells; RGC, retinal ganglion cells; MG, microglia; RPE, retinal pigment epithelium; Fib, fibroblasts; EC, endothelial cells; Gra, granulocyte; DC, dendritic cells; Mac, macrophages; T, T cells; B, B cells; Mast, mast cells. Bottom, stacked bar plot showing the cell type distribution in the neural retina layer, RPE-choroid layer. (G) t-SNE plots showing gene expression signatures of representative marker genes for different cell types. The color key from grey to red indicates low to high gene expression levels. (H) Bar plots showing the expression level of representative marker genes for various cell types. All expression levels are measured using the same scale. Data are shown as mean ± SEM. (I) Immunofluorescence analysis showing specific expression of RBP4 and ARR3 in monkey Cone, THY1 in RGC, GLUL in Müller, VSX2 and PKCα in Bipolar, as well as RPE65 in RPE cells. Scale bar, 50 μm. Asterisk represents the newly identified marker. (J) Heatmap showing the top-ranked 100 (ranked by average difference among different cell types) gene expression signatures of each cell type. Each column indicates the mean expression level of the corresponding cell type, and values in each row are z-score scaled. Low to high gene expression levels are indicated by color key from blue to red. Representative GO terms are shown to the right


