Figure 2.
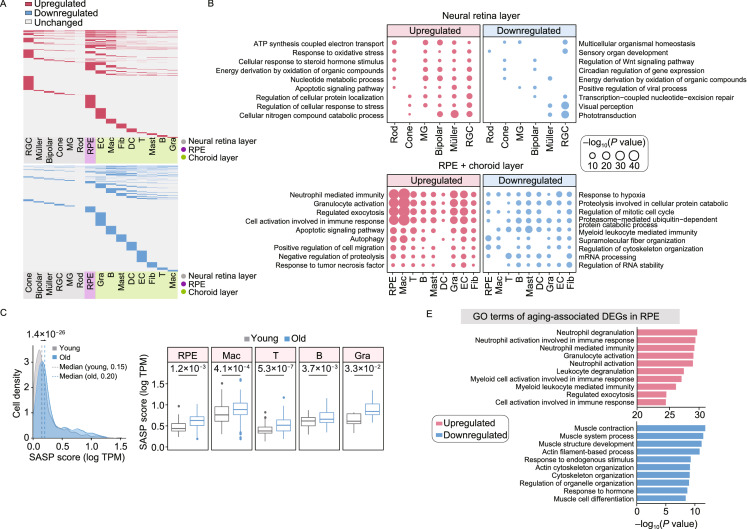
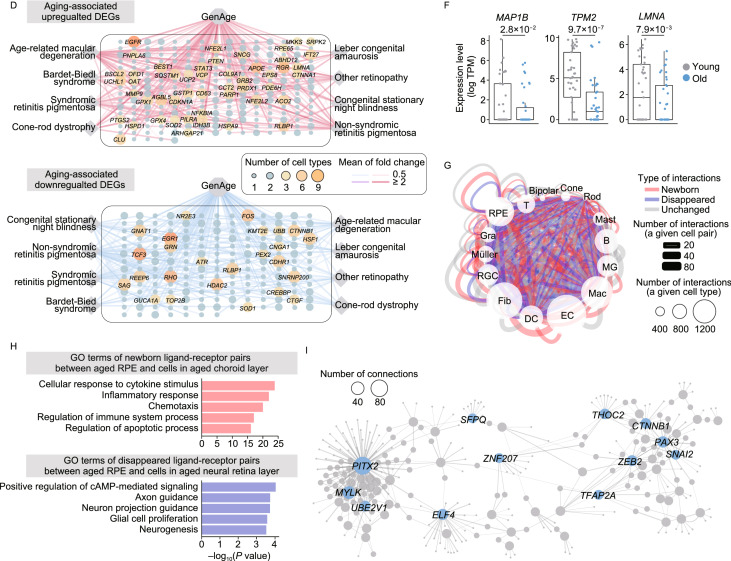
Age-related transcriptional alterations in various cell types of monkey retina and choroid. (A) Heatmaps showing upregulated (top) and downregulated (bottom) aging-associated DEGs in different cell types. DEGs present in at least two cell types are top-ranked in each panel. The shadow at the bottom of each panel indicates the layer corresponding to each cell type. (B) Dot plots showing GO terms of aging-associated DEGs in each cell type. Top, cell types from the neural retinal layer; bottom, cell types from the RPE-choroid layer. The dot size indicates the statistical significance of a corresponding GO term. (C) Left, density plot showing the cell distribution with different SASP scores in both young and old monkeys. Cells in all different cell types are considered. Grey and blue colors correspond to cells from young and old monkeys, respectively. Dashed lines indicate the median value of SASP score in cells from young (0.15) and old (0.20) monkeys, respectively; two-tailed Student’s t-test P value (1.4 × 10⁻²⁶) is indicated. Right, box plots showing SASP score in representative cell types including RPE cells and cells in choroid layer. Two-tailed Student’s t-test P values are indicated. SASP score is calculated as the average expression level of SASP-related genes in each cell. (D) Network visualization showing the overlapping genes between aging-associated DEGs (top, upregulated; bottom, downregulated) and given gene sets (including GenAge and retinal disease gene sets). Each node in this network indicates each gene, and each line indicates the correspondence between a given gene set and a given DEG. The node size and color indicate the number of cell types in which a given gene was differentially expressed during aging. The line thickness and color indicate the average value of log2-transformed fold change of corresponding cell type(s). Gene names with node size greater than three are shown. (E) Bar plots showing GO terms of upregulated (top) and downregulated (bottom) aging-associated DEGs in RPE cells. (F) Box plots showing the expression level of representative downregulated aging-associated DEGs of RPE cells. Each point represents a single cell. P values obtained from ROTS algorithm are indicated. (G) Network visualization showing cell-cell interactions among different cell types. The line color indicates the type of interactions; red, newborn interactions (only existed in aged monkeys); blue, disappeared interactions (only existed in young monkeys); grey, unchanged interactions (commonly existed in young and old monkeys). The line thickness indicates the number of interactions between a given cell pair, and the dot size indicates the number of interactions in a given cell type. (H) Bar plots showing GO terms of newborn ligand-receptor gene pairs between aged RPE cells and cells in aged choroid layer (top), and disappeared ligand-receptor gene pairs between aged RPE cells and cells in aged neural retina layer (bottom). (I) Regulatory network showing potentially core transcriptional regulators in downregulated aging-associated DEGs of RPE cells. The line thickness indicates the weight of a connection, and the dot size indicates the number of connections. Gene names of top-ranked 10 nodes (ranked by the number of connections) are shown


