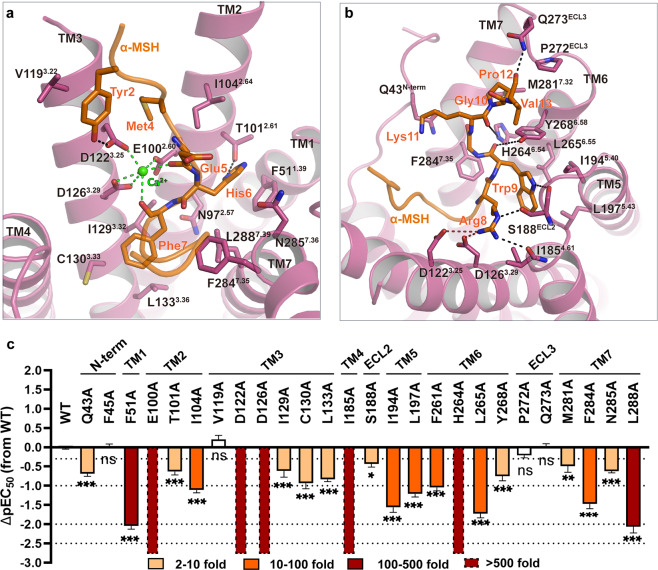
Fig. 2. The binding pocket of α-MSH in MC4R.
a, b Detailed interactions of α-MSH (orange) with MC4R (plum). Structure viewed from the extracellular side shows the interaction network between MC4R, α-MSH, and Ca2+. c α-MSH-induced cAMP accumulation assays of the residues involved in α-MSH binding. Bars represent differences in calculated α-MSH potency [pEC50] for representative mutants relative to the wild-type receptor (WT). Data are colored according to the extent of effect. nsP > 0.01, *P < 0.01, **P < 0.001 and ***P < 0.0001 (one-way ANOVA followed by Dunnett’s multiple comparisons test, compared with the response of WT). See Supplementary information, Table S4 for detailed statistical evaluation and receptor expression levels.

