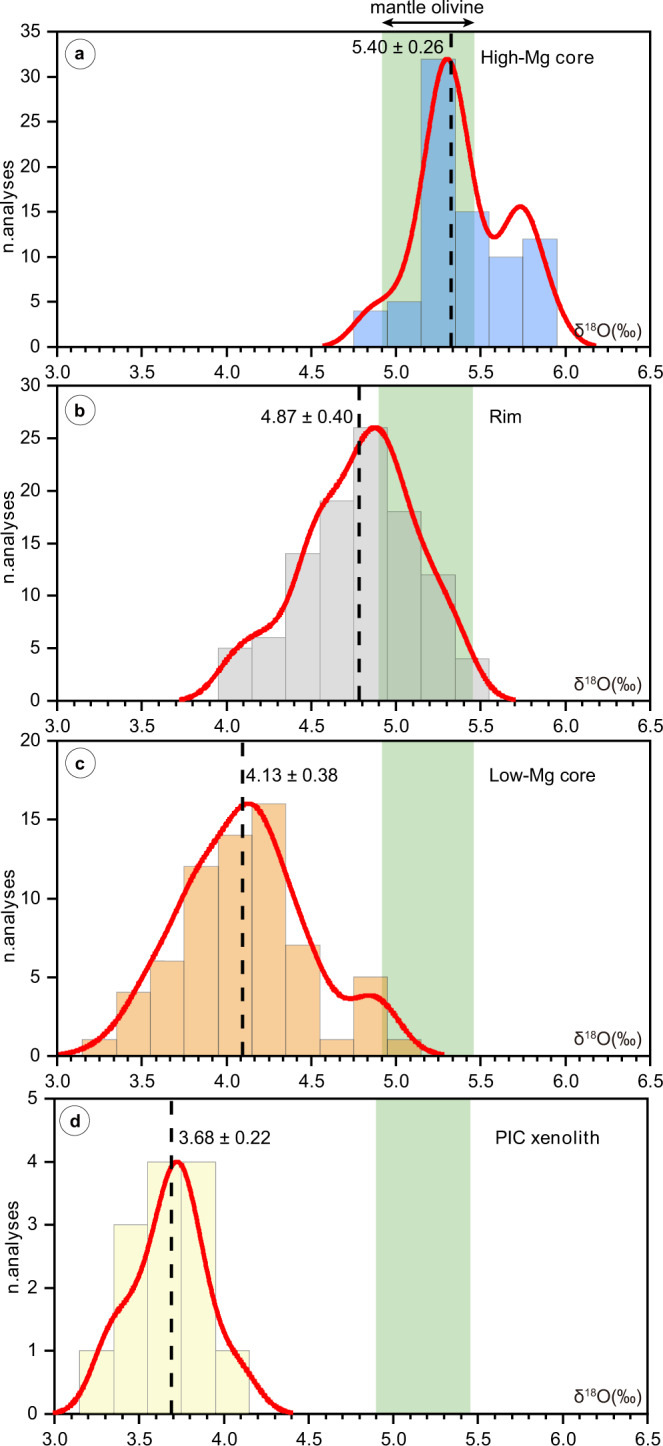
Fig. 4. Probability distribution plots of oxygen isotope compositions in olivine from this study.

a High-Mg olivine cores, b olivine rims, and c low-Mg olivine cores in the examined kimberlites and lamproites, and d olivine in PIC-like xenoliths. The dashed lines and associated numbers (±1 standard deviation) indicate average δ18O values for each probability distribution plot. Green bands represent the mantle olivine value (5.18 ± 0.28‰; see ref. 3).
