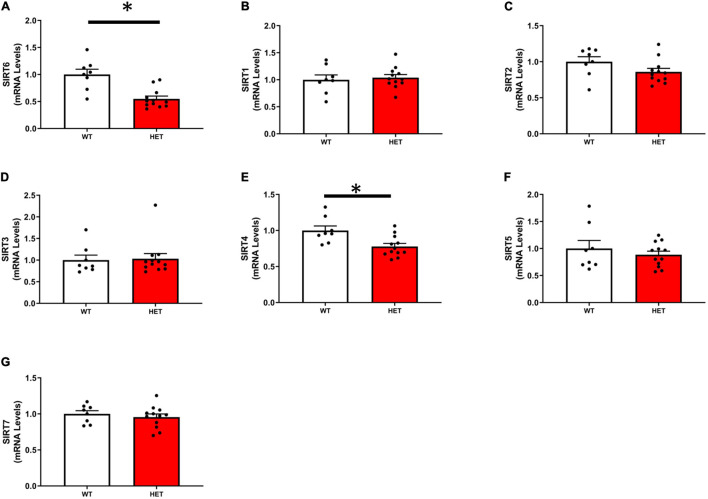
FIGURE 1.
Expression of individual sirtuin isoforms in SIRT6+/+ and SIRT6+/– mice. (A) Demonstrates successful significant reduction of SIRT6 expression in SIRT6+/– mice by ∼50%. Expression of other sirtuin isoforms was reduced [only SIRT2 and SIRT4, (C,E)] or unchanged by genetic inactivation of one copy of SIRT6 (B,D,F,G). (SIRT6+/+ n = 9 and SIRT6+/– n = 12). * denotes p < 0.05.

