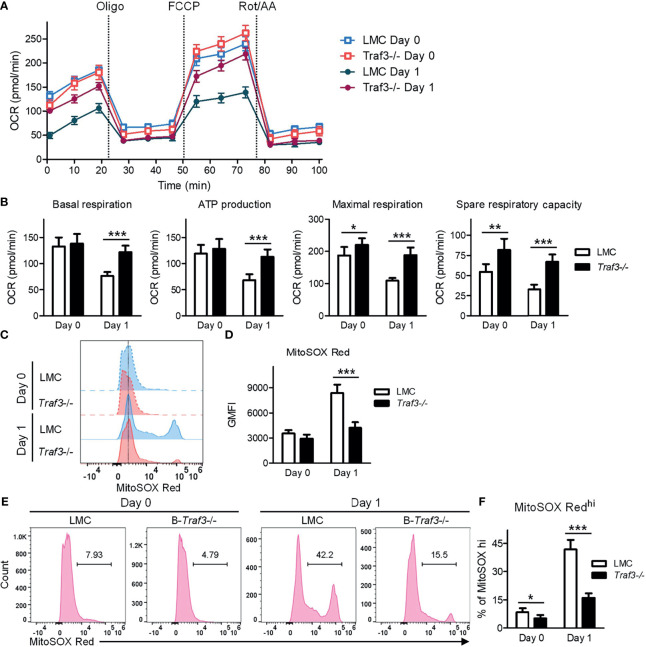
Figure 5.
Regulation of mitochondrial function by TRAF3 in resting B cells. Splenic B cells were purified from gender-matched, young adult (8-12-week-old) naïve LMC or B-Traf3 -/- mice. Purified cells were analyzed directly (Day 0) or at day 1 after ex vivo culture. (A, B) Mitochondrial respiration and energy production determined by the Seahorse Cell Mito Stress Test. (A) Kinetic changes of the oxygen consumption rate (OCR). Injection time points of oligomycin (Oligo), FCCP and rotenone/antimycin A (Rot/AA) are indicated in the figure. (B) Graphical results of the OCRs for basal respiration, ATP production, maximal respiration and spare respiratory capacity. (C–F) Mitochondrial superoxide levels analyzed MitoSOX Red staining and flow cytometry. (C) Representative FACS histogram overlay comparing the levels of MitoSOX Red staining intensity. (D) Graphical results of the geometric mean (GM) of MitoSOX Red fluorescence intensity (FI). (E) Representative FACS profiles showing the gated MitoSOX Redhi populations. (F) Graphical results of the percentage of MitoSOX Redhi subsets. (B, D, F) Graphs shown are the mean ± SD (n = 6/group; *p < 0.05; **p < 0.01; ***p < 0.001 by t test).

