
Figure 3.
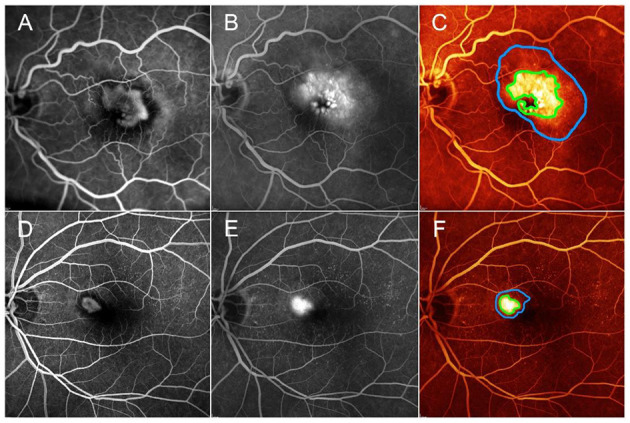
One case of low-MNV/leakage ratio, corresponding to high exudation area compared with MNV lesion detected on fluorescein angiography (A,B). MNV area and leakage area are marked by green and blue lines, respectively (C). One case of high-MNV/leakage ratio, corresponding to a lower exudation area, compared with MNV lesion detected on fluorescein angiography (D,E). MNV area and leakage area are marked by green and blue lines, respectively (F). Green V and red X correspond to the quadrants showing SF or quadrants without SF, as detected by FA, respectively.