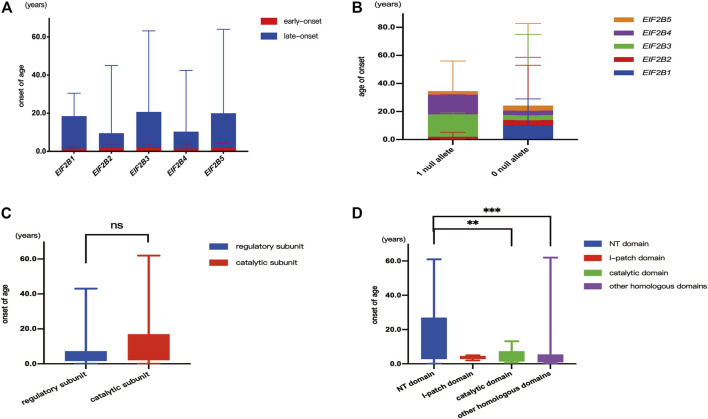
FIGURE 3.
Genotype-age of onset correlation. (A): Correlation between the mutant gene (EIF2B1-5) and age of onset. (B): Correlation between number of null alleles and age of onset. (C): Correlation between missense mutations located in different subunit and age at onset. (D): Correlation between missense mutations located in different structural domain and age of onset. “**”denotes p < 0.01, “***” denotes p < 0.001, “ns” indicates no statistical difference.

