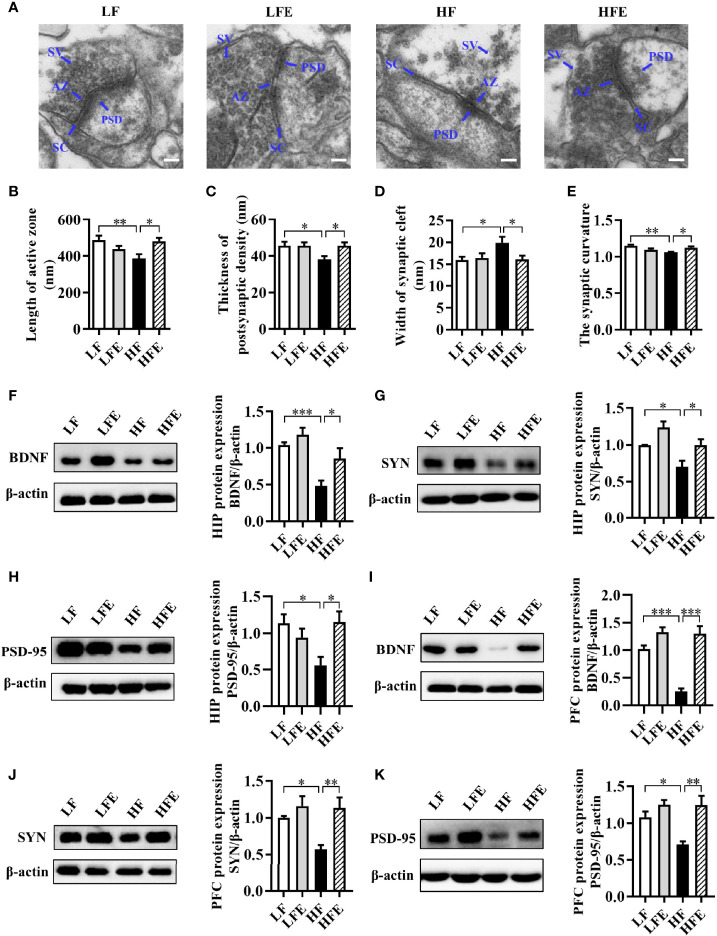
Figure 3.
ESPs supplementation ameliorated synaptic impairment in the HIP and PFC of HF diet-induced obese mice. (A) Representative ultrastructure of synapses in the CA1 region of mice on the electron micrograph (scale bar 100 nm). (B–E) Image analysis of the length of active zone, thickness of postsynaptic density, width of the synaptic cleft, and the synaptic curvature (n = 3, 6 images per mouse). AZ, active zone; PSD, postsynaptic density; SC, synaptic cleft; SV, synaptic vesicle. (F–H) The protein expression levels of BDNF, SYN and PSD-95 in the HIP (n = 8). (I–K) The protein expression levels of BDNF, SYN and PSD-95 in the PFC (n = 8). Values are represented as mean ± SEM. * P < 0.05, ** P < 0.01, *** P < 0.001. Tukey-Kramer test.

