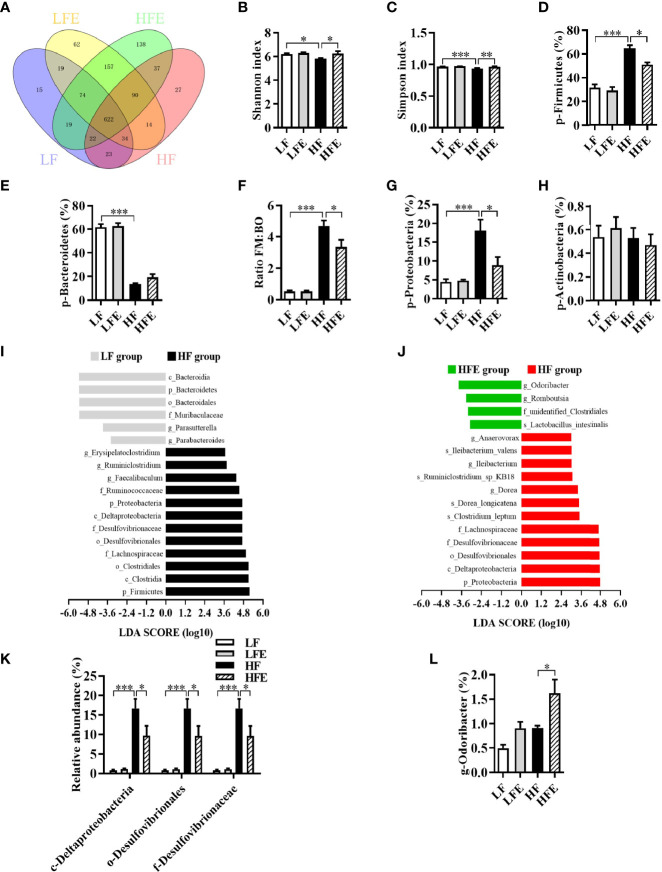
Figure 5.
ESPs supplementation attenuated gut microbiota dysbiosis in HF diet-induced obese mice. (A) Venn diagram of operational taxonomic units (OTUs). (B) Shannon index. (C) Simpson index. (D) Relative abundance of Firmicutes. (E) Relative abundance of Bacteroidetes. (F) Ratio of Firmicutes (FM) proportion to Bacteroidetes (BM) proportion (Ratio FM/BO). (G) Relative abundance of Proteobacteria. (H) Relative abundance of Actinobacteria. (I, J) Linear discriminant analysis (LDA) effect size (LEfSe) showing the most differentially significant abundant taxa enriched in microbiota from the HF vs. LF and HFE vs. HF groups. (K) Comparison of the representative taxonomic abundance of Proteobacteria among the LF, LFE, HF, and HFE groups at the class, order and family levels. (L) Comparison of the representative taxonomic abundance of Bacteroidetes among the LF, LFE, HF, and HFE groups at the genus level. Values are represented as mean ± SEM. n = 6. * P < 0.05, ** P < 0.01, *** P < 0.001. LDA score > 3.0 was considered significant. p, phylum; c, class; o, order; f, family; g, genus.

