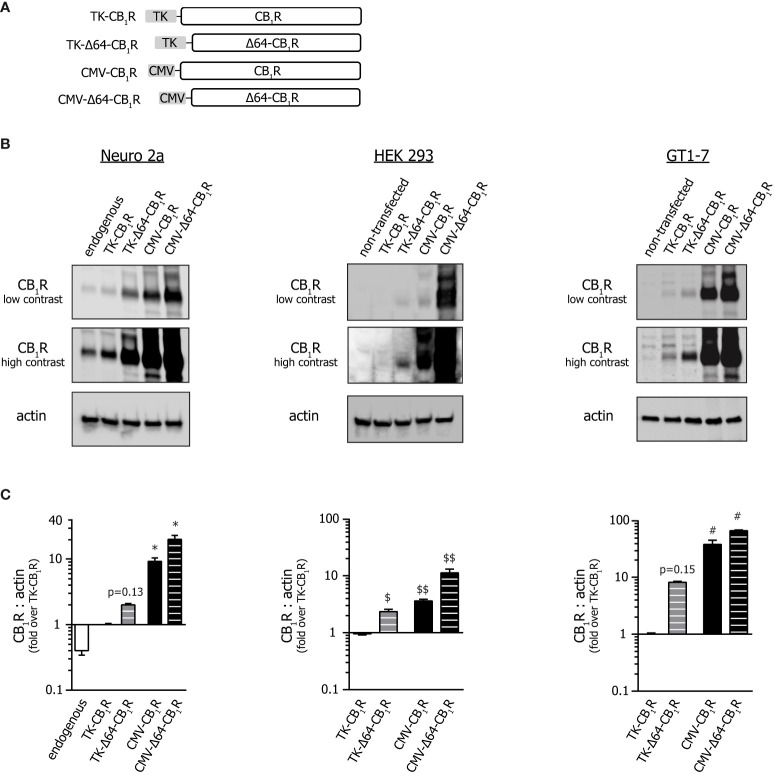
Figure 1.
Effect of promoter and N-terminal truncation on CB1R expression. (A) Schematic representation of the various CB1R clones used throughout the study. (For GFP-tagged versions, see Supplementary Figure 3A.) (B) Western blot analysis of the expression of various CB1R constructs in Neuro 2a, HEK 293 and GT1-7 cells. Cells were transfected with different CB1R constructs or with empty plasmid (pcDNA3.1(+); ‘non-transfected’); in order to perceive the differences in expression better, both low and high contrast representations of the same 16-bit raw images are presented. (C) Statistical analysis of immunoblots shown on Panel (B). CB1R to actin expression ratios were normalized to that obtained in TK-CB1R expressing samples. From left to right n= 9-13-14-12-11 (Neuro 2a); 14-13-11-10 (HEK 293) and 11-9-10-10 (GT1-7); *p < 0.0003, $p = 0.0152, $$p < 0.0001 and #p < 0.0001 as compared to pertinent TK-CB1R group (Kruskal-Wallis ANOVA followed by Dunn’s multiple comparisons test).

