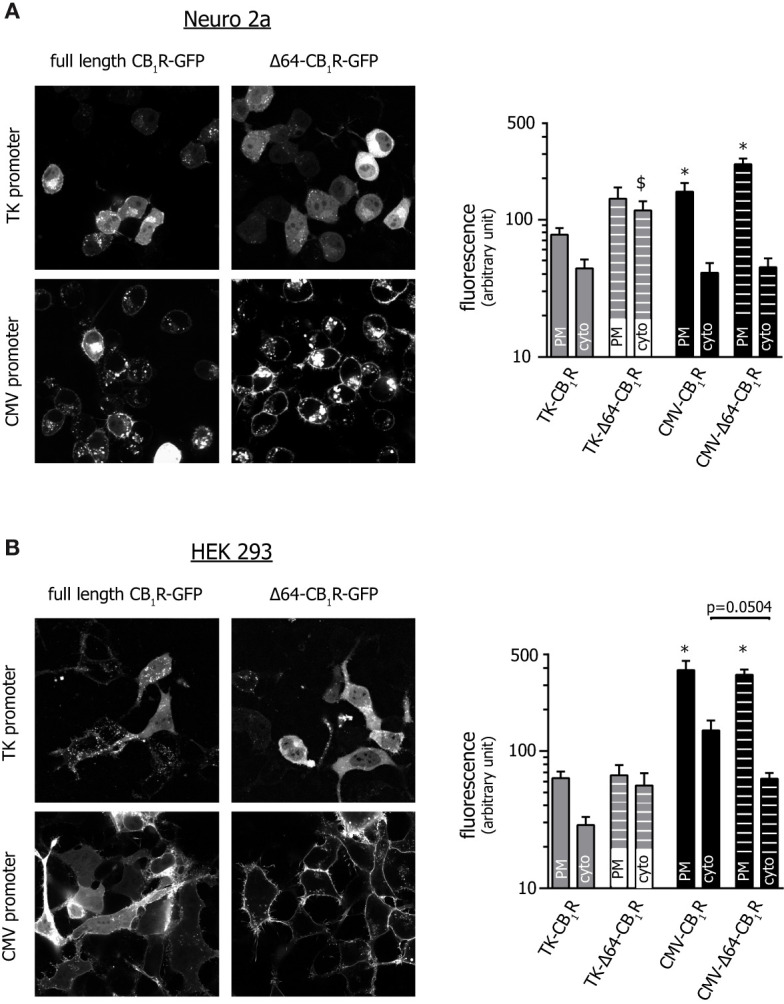
Figure 3.

Confocal microscopic assessment of the localization of various CB1R mutants. Images of Neuro 2a (A) and HEK 293 (B) cells expressing GFP-tagged versions of the pertinent CB1 receptor variants were acquired with spinning disk confocal microscopy along the entire z-axis of the cell. Slices positioned at the bottom 1/3 (i.e. close to the cell-coverslip interface) are presented and show an area of approx. 100 x 100 µm. (Please note that due to the significant differences in expression, the brightness of images showing TK promoter-driven receptor variants was increased to a higher extent.) Bar graphs show average plasma membrane and cytosolic fluorescent intensity after background subtraction. In all groups n=16; *p < 0.05 when compared to TK-CB1R PM (one-way ANOVA followed by Dunn’s or Holm-Sidak’s multiple comparisons test for Neuro 2a and HEK 293, respectively), $p = 0.012 vs. TK-CB1R-cyto (one-way ANOVA and Dunn’s test), for the comparison between CMV-CB1R-cyto and CMV-Δ64-CB1R-cyto one-way ANOVA and Holm-Sidak’s test were applied.
