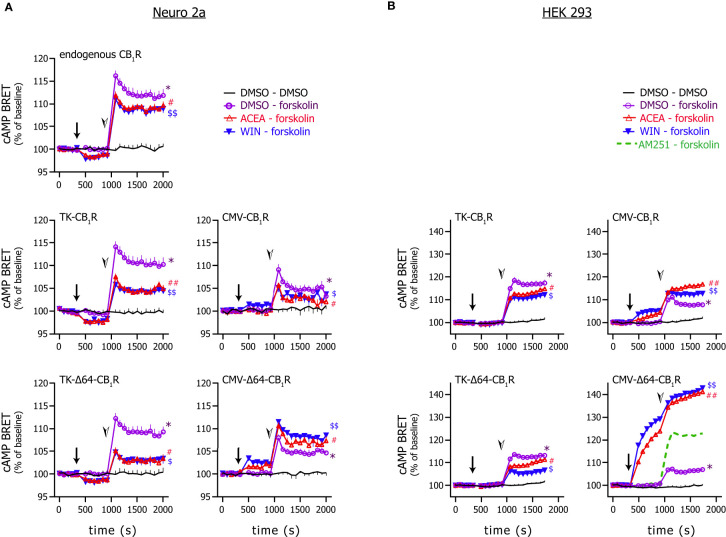
Figure 4.
Effect of CB1R stimulation on cytosolic cAMP. Neuro 2a (A) and HEK 293 (B) cells expressing the EPAC-based intramolecular cAMP sensor together with the indicated CB1R variant were stimulated first with the CB1R agonists ACEA (20 µM) or WIN55,212-2 (1 µM) or vehicle (arrows) followed by the addition of forskolin (1 µM) or vehicle (arrowheads). BRET ratios were normalized to the average measured during control period. (In one experiment, the effect of the CB1R inverse agonist AM251 (2 µM) was also tested instead of CB1R agonist; average of 3 wells are shown.) Number of observations was min. 8 wells from 3 independent experiments. In some cases, to aid perceptibility, mean + or – S.E.M are presented only; in some graphs, symbols are larger than error bars and thus the latter are not visible. Data were analysed with 2-way ANOVA in combination with Dunnett’s multiple comparisons test. Symbols represent significances as follows: *: significant difference (p < 0.0001) vs. DMSO-DMSO detected after the addition of forskolin; # and $: significant difference (p < 0.0001) vs. DMSO-forskolin detected after the addition of forskolin; ## and $$: significant difference (p < 0.05) vs. DMSO-forskolin detected already after the addition of the CB1R agonist and before forskolin stimulation and significance increased (p < 0.0001) after the addition of forskolin.

