
Figure 3.
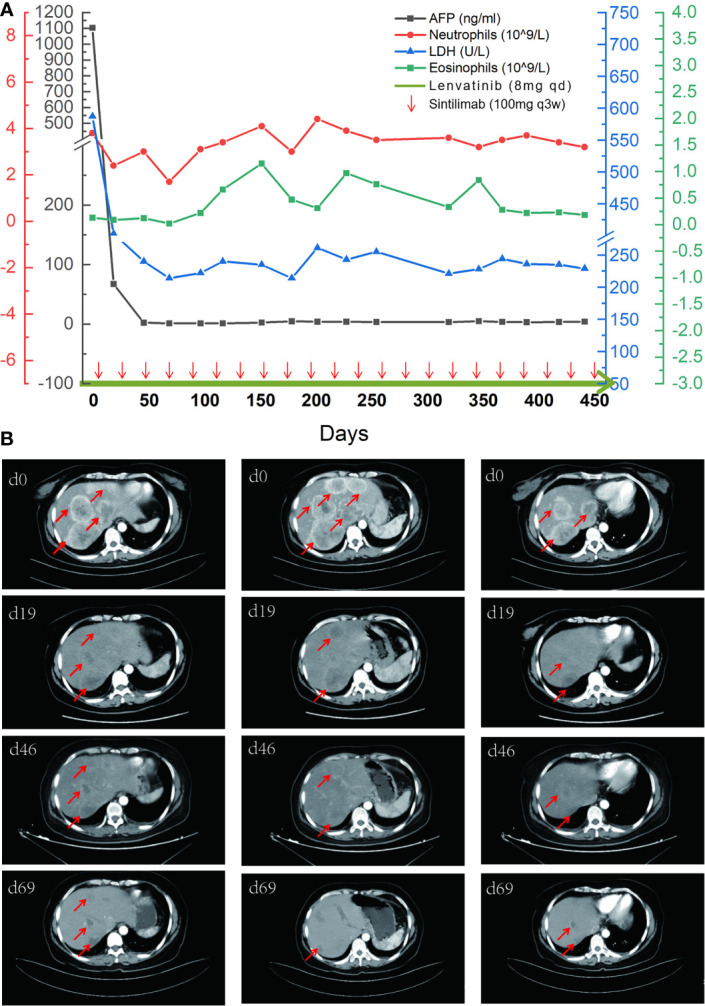
The comparison of tumor indicators and CT images. (A) A timeline outlining the treatment course (lenvatinib 8 mg, orally, qd; and sintilimab 100 mg, intravenous glucose tolerance test, q21d) and changes of laboratory indicators including alpha-fetoprotein (AFP), neutrophils, lactate dehydrogenase (LDH), and eosinophils. (B) Imaging changes of the first four times of evaluation with tumor lesions marked by red arrows.