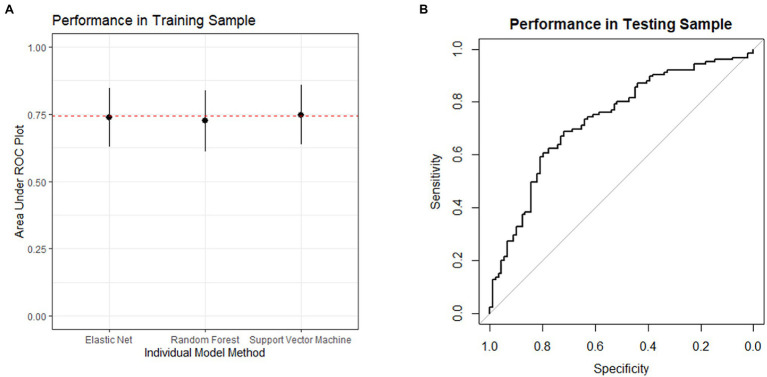
Figure 2.
(A) depicts the performance in the training sample during model development. The performance of each model in the algorithm is depicted as the mean area under the receiver operating characteristic plot. The error bars represent the standard deviation. The dashed line represents the performance of the ensemble model. (B) depicts the receiver operating characteristic plot for the model’s performance when applied to the testing sample. The area under the curve is 0.74, and the lower bound of the 95% confidence interval is 0.67.

