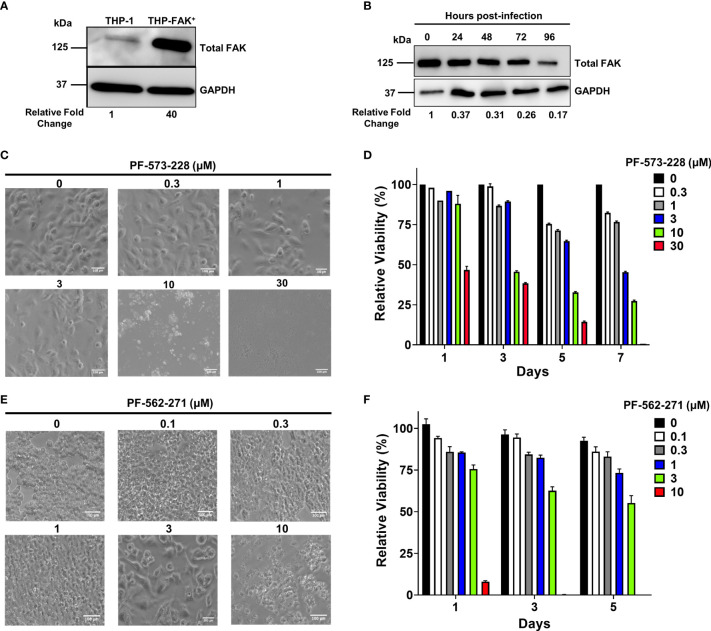
Figure 2.
Genetic overexpression and pharmacological inhibition of FAK. (A) Total FAK protein levels in cell lysates of THP-1 and THP-1 cells stably overexpressing FAK (THP-FAK+) were analyzed by western blot. (B) THP-FAK+ macrophages were infected with Mtb at an MOI of 10 and cell lysates were prepared at indicated time points, and analysed by western blot. Blots shown in (A, B) are representative of three independent experiments. Densitometry analysis of the blots were performed using Image Quant LAS 4000 software with intensities normalized to GAPDH. Relative fold change of total FAK levels was expressed relative to THP-1 cells (A) and uninfected THP-FAK+ cells (B). (C, D) THP-1 macrophages were treated with varying concentrations of PF-573-228 for 5 days, and (C) representative phase-contrast microscopy (20x objective) images are shown along with (D) quantification of cell viability using the resazurin assay. (E, F) RAW 264.7 macrophages were treated with varying concentrations of PF-562-271 for 5 days, and (E) representative phase-contrast microscopy (20x objective) images are shown along with (F) quantification of cell viability using the resazurin assay. Images are representative of 3 visual fields for each inhibitor concentration. Relative viability is normalized to untreated control cells as 100%. Error bars represent the mean ± SD of three independent biological replicates. Scale bar, 100 μm.

