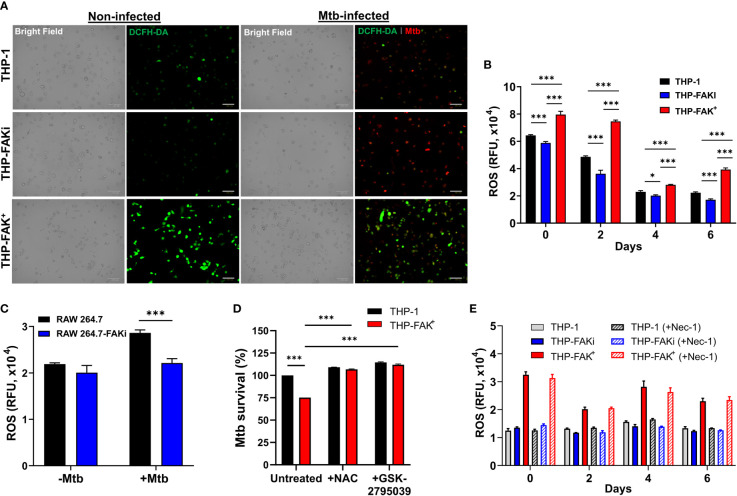
Figure 7.
Expression of FAK induces production of ROS to control Mtb infection. (A) THP-1, THP-FAKi, and THP-FAK+ macrophages were infected with Mtb-tdTomato (red signal) for 6 days, after which cells were stained with DCFH-DA (5 μM, green signal) for 30 minutes at 37°C. Representative Bright Field and fluorescence images of uninfected and Mtb-infected (red) macrophages (green, ROS), are shown using a 20x objective. Scale bar, 100 μm. (B) THP-1 macrophages were infected and stained with DCFH-DA as in (A) and the amount of ROS production was quantified at the indicated time points post-infection using a fluorescence plate reader at 485 nm/535 nm. (C) RAW 264.7 macrophages were infected and stained as in (A) and the amount of ROS production was quantified at day 6 post-infection. (D) THP-1 and THP-FAK+ macrophage were pre-treated with 10 mM N-acetyl-cysteine (NAC) or 25 µM GSK2795039 for 24 h and then infected with Mtb-luciferase at an MOI of 10. Infected macrophages were lysed at day 6 post-infection and the resultant luminescence signal was measured as a proxy for the relative number of viable of Mtb. RLU signals were normalised to mock treated THP-1 cells as 100% and depicted as % Mtb survival. (E) THP-1, THP-FAKi, and THP-FAK+ macrophages were mock treated or pre-treated with 30 µM necrostatin-1 for 24 h, after which cells were infected with Mtb at MOI of 10. At indicated time points post-infection, infected macrophages were stained with DCFH-DA as in (A) and fluorescence signals for ROS production was measured. Error bars represent the mean ± SD of three independent biological replicates. *p < 0.05, ***p < 0.001.

