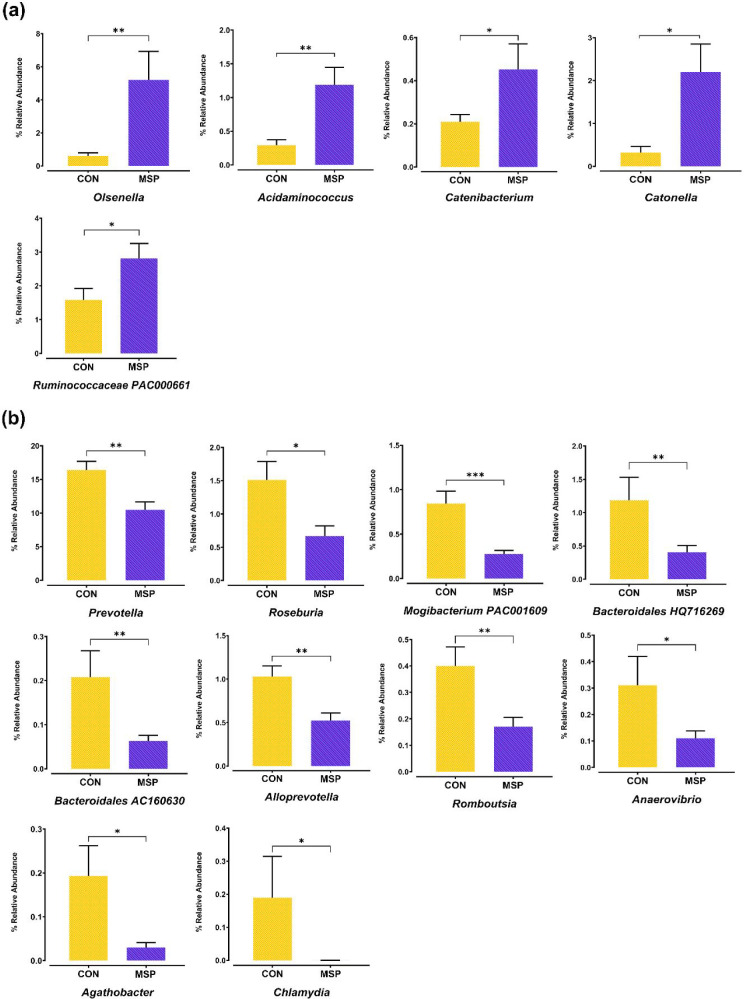
Fig. 4. Relative abundances of selected taxa.
Comparisons of the relative abundances of selected taxa identified by the linear discriminant analysis effect size (LEfSe) analyses. A p-values were calculated using Kruskal-Wallis H test. Significant values are denoted by *p < 0.05, **p < 0.01 and ***p < 0.001. CON, basal diet (n=18); MSP, basal diet with multispecies probiotics containing Bacillus amyloliquefaciens G10, Levilactobacillus brevis M10, Limosilactobacillus reuteri RTR (n=20).

