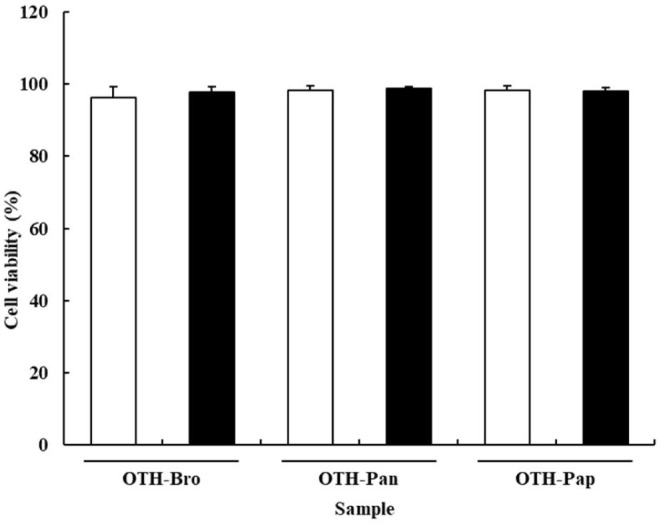
Fig. 1. Effects of OTF hydrolysates on RAW 264.7 cell viability.

□, 250 μg/mL of OTF hydrolysates; ■, 500 μg/mL of OTF hydrolysates. Values are expressed as the means of triplicates ± SD. Cell viability (%) = absorbance of the sample/absorbance of the blank × 100. OTF, ovotransferrin; Bro, bromelain; Pan, pancreatin; Pap, papain.
