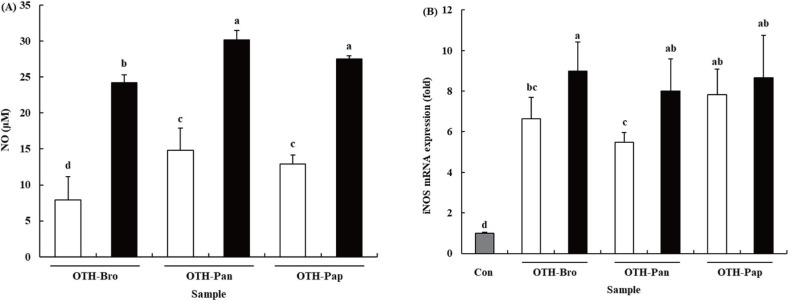
Fig. 2. OTF hydrolysates upregulate the production of NO (A) and the secretion of iNOS (B) of RAW 264.7 macrophages.
□, 250 μg/mL of OTF hydrolysates; ■, 500 μg/mL of OTF hydrolysates; Con, only medium-treated group. Values represent the mean ± SD. a–dDifferent letters above bars denote statistically significant difference (p < 0.05). OTF, ovotransferrin; Bro, bromelain; Pan, pancreatin; Pap, papain; NO, nitric oxide; iNOS, inducible nitric oxide synthase.

