
Fig. 3.
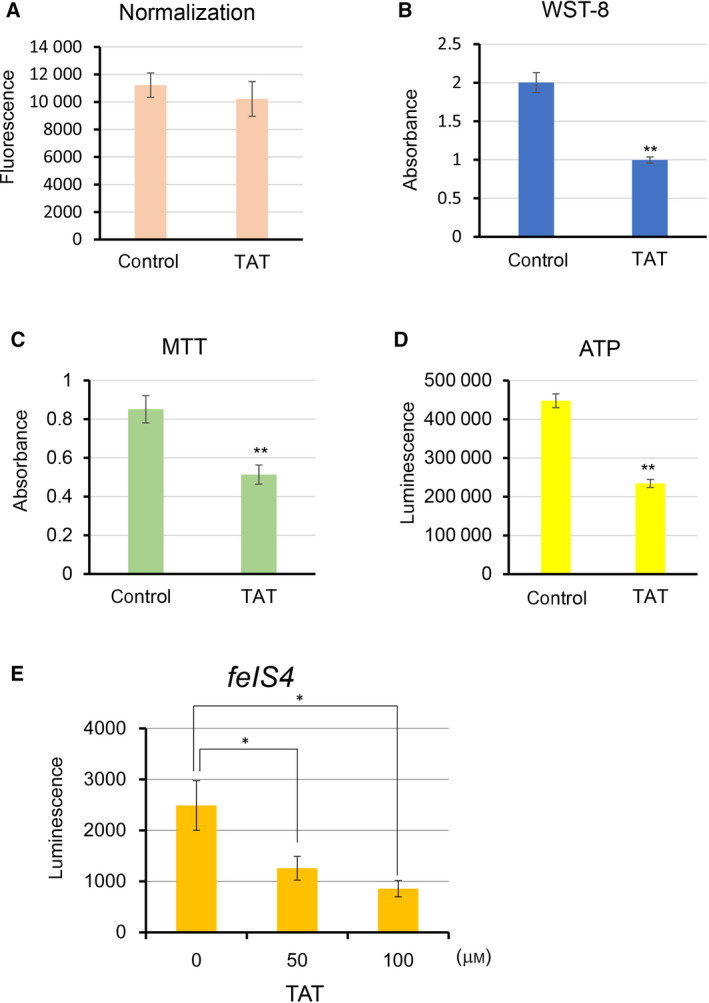
TAT leads to decreased intracellular metabolism and ATP production. (A) Viable cells were measured using a Hoechst 33342 after 48 h at 25 μm TAT‐treated HeLa cells. (B–D) Cell metabolic activity (B, C) and ATP levels (D) of HeLa cells treated with 25 μm TAT were measured after 48 h and simultaneously normalized by the number of viable cells measured by the Hoechst 33342. WST‐8 measures intracellular dehydrogenase activity, and MTT measures mitochondrial reductase activity. (E) Measurement of intracellular ATP as an indicator in the C. elegans FeIS4 strain, which contains a luciferase transgene, after treatment with varying levels of TAT. Means ± standard deviation are shown (n = 3; *P < 0.05, **P < 0.001, Student's t‐test).