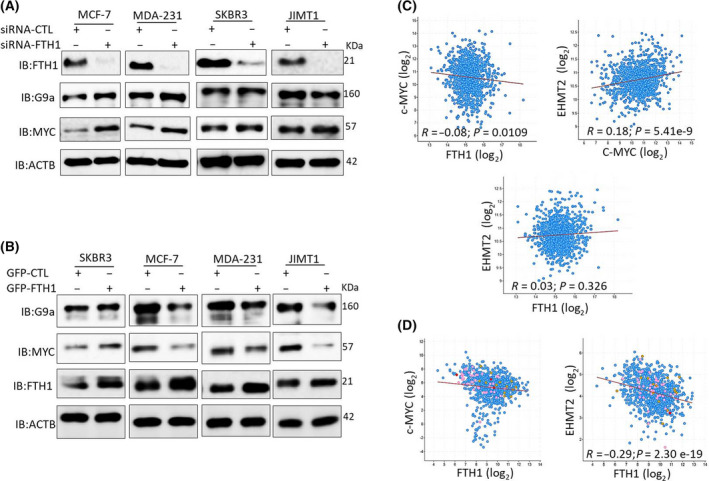
Fig. 4.

FTH1 expression negatively correlates with c‐MYC and G9a in BCa cell lines and tissues. (A) Expression of FTH1, c‐MYC, and G9a was evaluated by western blotting in MDA‐MB‐231, JIMT1, SKBR3, and MCF‐7 cells at 72 h post‐FTH1 silencing. (B) Expression of FTH1, c‐MYC, and G9a was evaluated by western blotting in MDA‐MB‐231, JIMT1, SKBR3, and MCF‐7 cells at 72 h post‐FTH1 overexpression. Coexpression analysis of FTH1 vs c‐MYC, FTH1 vs G9a (EHMT2), and c‐MYC vs G9a in (C) 1084 BCa tissue samples (Breast Invasive Carcinoma, TCGA, PanCancer Atlas, 2018) and (D) in 921 cancer cell lines (Broad Institute and Novartis, 2019; Broad CCLE Portal.) using the c‐BioPortal Cancer Genomics portal.
