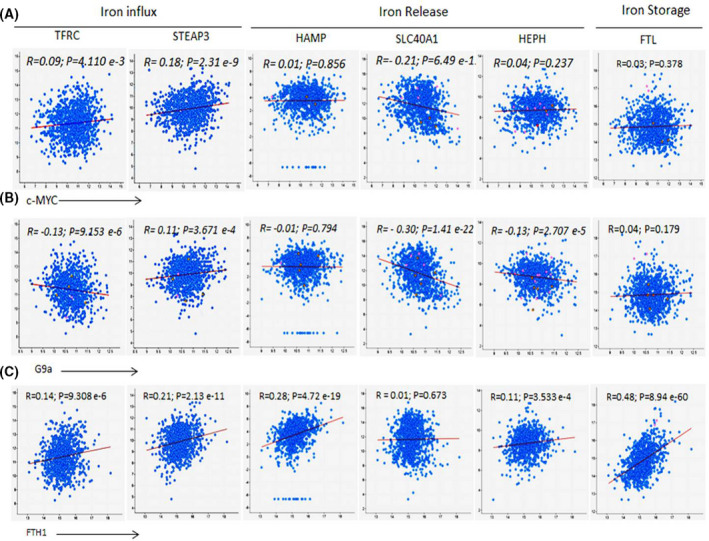
Fig. 6.

Correlation of FTH1, MYC, and G9a with key IRGs in BCa samples. mRNA coexpression analysis of (A) c‐MYC, (B) G9a, or (C) FTH1 vs genes that encode the TfR1 gene (TFRC), STEAP3, hepcidin (HAMP), FPN (SLC40A1), hephaestin (HEPH), and FTL chain using TCGA BCa dataset (1084 patient samples; http://www.cbioportal.org); R and P values were generated using Pearson statistic.
