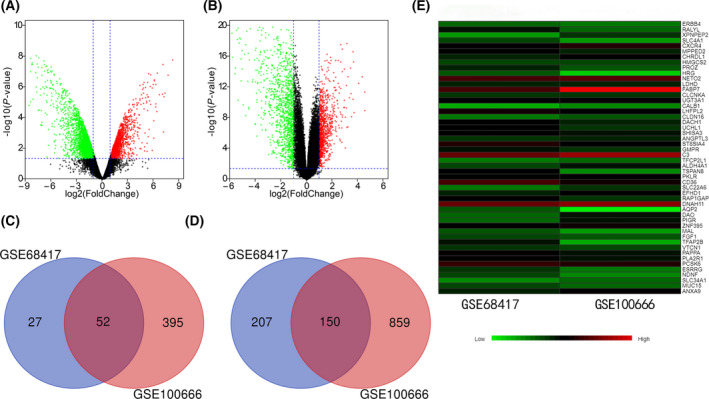
Fig. 1.

DEGs volcano, Venn, and heat maps. The volcano graph (A) is the result of the GSE100666 data set, and the volcano graph (B) represents the result of the GSE68417 data set. The abscissa is log2FC, and the ordinate is ‐log10 (P value). The red and green spots represent upregulated and downregulated DEGs, respectively. The Venn diagram (C) represents the common upregulation of DEGs in the two datasets, and the Venn diagram (D) represents the common downregulation of DEGs in the two datasets. Heat map (E) represents the top 50 of DEGs where the two data sets intersect.
