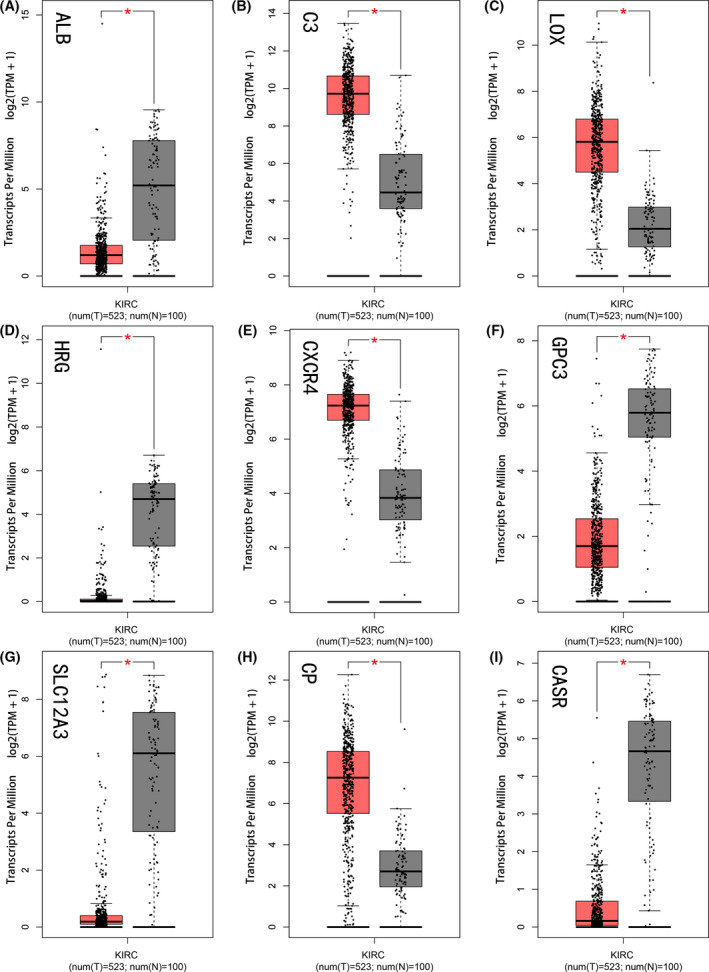
Fig. 5.

The expression of 9 HUB genes in tumor tissues and normal tissues in GEPIA. The red and gray boxes represent cancer and normal tissue, respectively. (A) ALB, (B) C3, (C) LOX, (D) HRG, (E) CXCR4, (F) GPC3, (G) SLC12A3, (H) CP, (I) CASR. Error bars represent standard deviation. *P < 0.05 was as statistically significant.
