
Fig. 8.
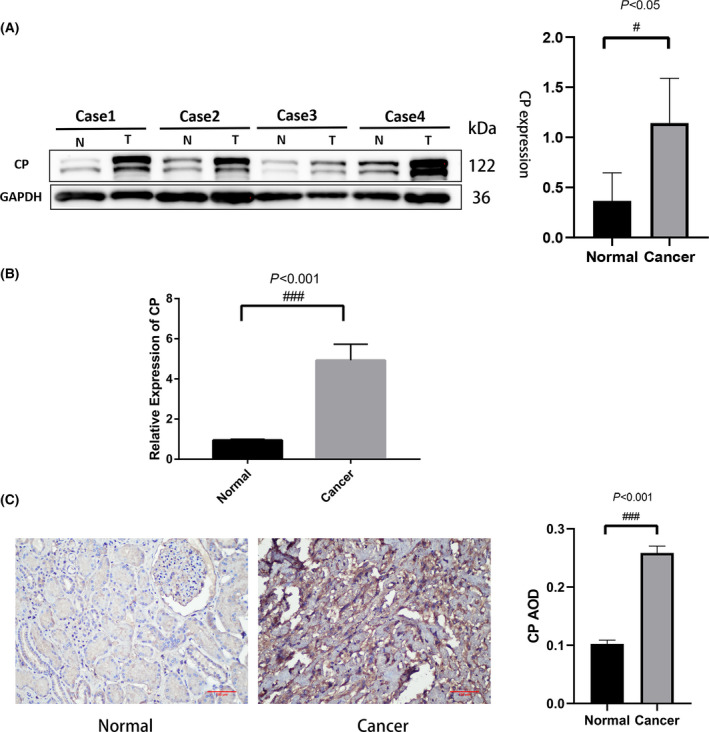
Expression of CP in renal cell carcinoma and adjacent normal tissues. (A) Western blots showing CP expression in renal cell carcinoma and adjacent normal tissues, n = 4. (B) Quantitative real‐time RT‐PCR showing CP mRNA expression, n = 3. (C) CP immunohistochemical staining for CP in renal cell carcinoma and adjacent normal tissues, n = 3. Significant differences in quantitative data were compared by unpaired t‐test. Error bars represent standard deviation. Scale bar 100 μm, P < 0.05 was as statistically significant.