
Fig. 9.
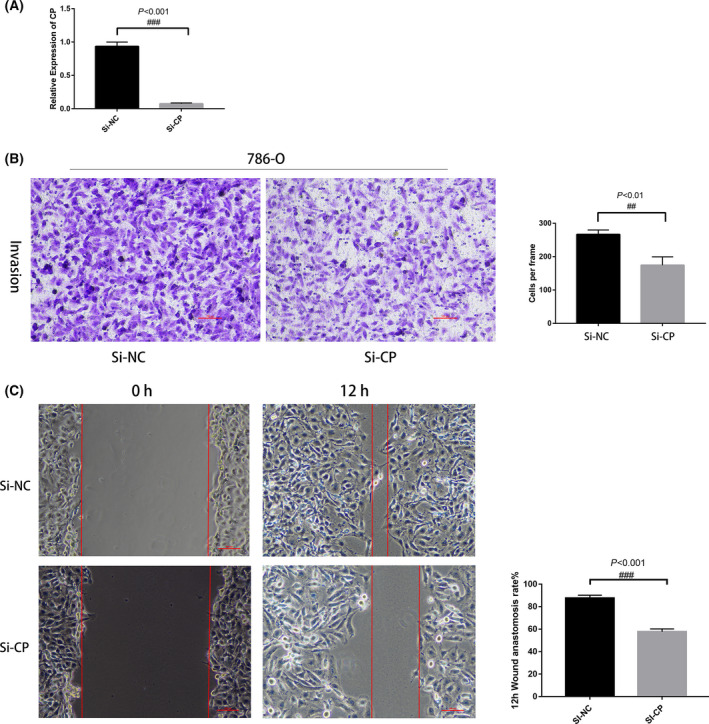
Biological function of CP in 786‐O cell lines. (A) qRT‐PCR showing SI‐CP mRNA expression, n = 3. (B) Transwell assay of CP, n = 3. (C) Wound healing assay, n = 3. Significant differences in quantitative data were compared by unpaired t‐test. Error bars represent standard deviation. Scale bar 100 μm, P < 0.05 was as statistically significant.