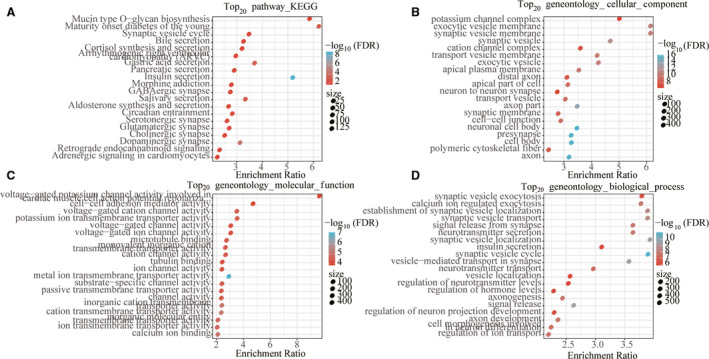
Fig. 5.

Functional analysis of differentially coexpressed genes. (A) The DEGs were enriched to the top 20 enriched by KEGG. (B) The DEGs were enriched to the top 20 enriched by GO CC. (C) The DEGs were enriched to the top 20 enriched by GO MF. (D) The DEGs were enriched to the top 20 enriched by GO BP. The color from red to blue represents the significance of P value; the darker the red the smaller is the P value, and the dot size represents the number of genes enriched into the pathway (the higher the number, the larger the dot).
