Fig. 11.

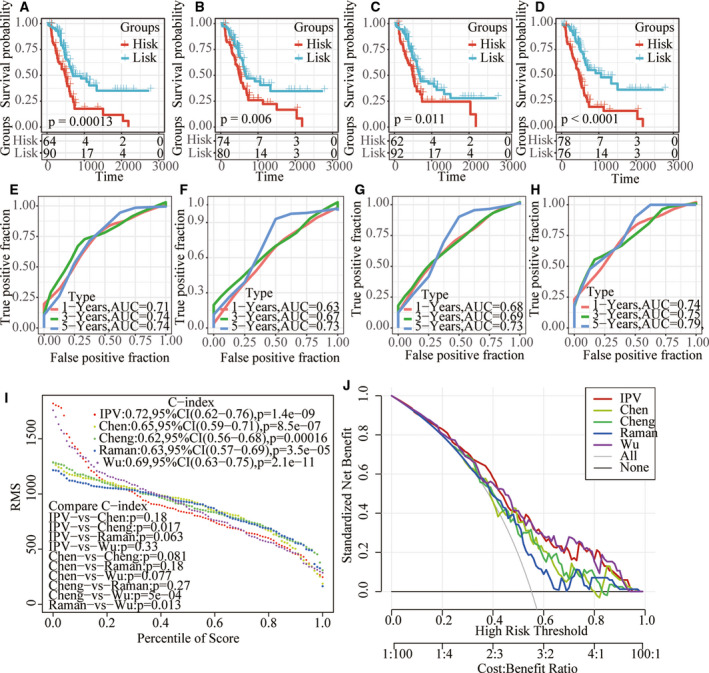
The superiority of the risk model. (A–D) KM prognosis curve of four models. (E–H) AUC of 1, 3, 5 and 3 years in four models. (I) RMS curves of five models. (J) Risk coefficient curves of five models.

The superiority of the risk model. (A–D) KM prognosis curve of four models. (E–H) AUC of 1, 3, 5 and 3 years in four models. (I) RMS curves of five models. (J) Risk coefficient curves of five models.