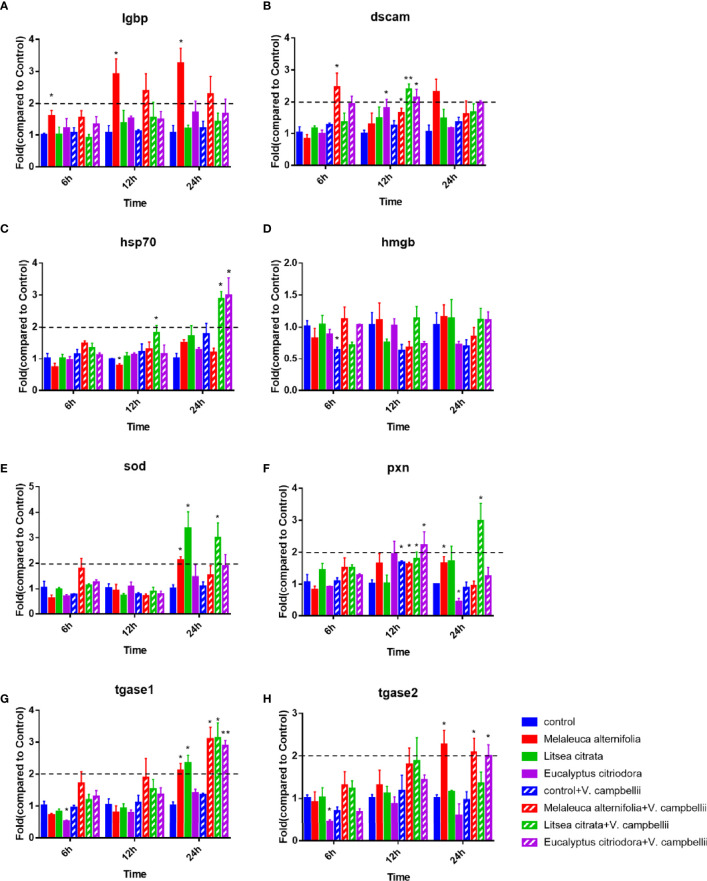
Figure 3.
Relative expression of lgbp (A), dscam (B), hsp 70 (C) and hmgb (D), sod (E), pxn (F), tgase 1 (G), and tgase 2 (H) genes in Artemia larvae. The unchallenged Artemia larvae served as control. For each gene, the expression in control was set at 1, and the expression in different treatments was normalized accordingly using the 2−ΔΔCT method. The geomean of the EF-1 and GAPDH was used as internal control. Data were average ± standard error of three replicates. Asterisks indicated a significant difference when compared to control (independent samples t-test; *P < 0.032; **P < 0.0021). EF-1, elongation factor 1; GAPDH, glyceraldehyde-3-phosphate dehydrogenase; lgbp, lipopolysaccharide and β-1,3-glucan-binding protein; dscam, down syndrome cell adhesion molecule; hsp 70, heat shock protein 70; hmgb, high mobility group box protein; sod, superoxidase dismutase; pxn, peroxinectin; tgase 1, transglutaminase 1; tgase 2, transglutaminase 2.

