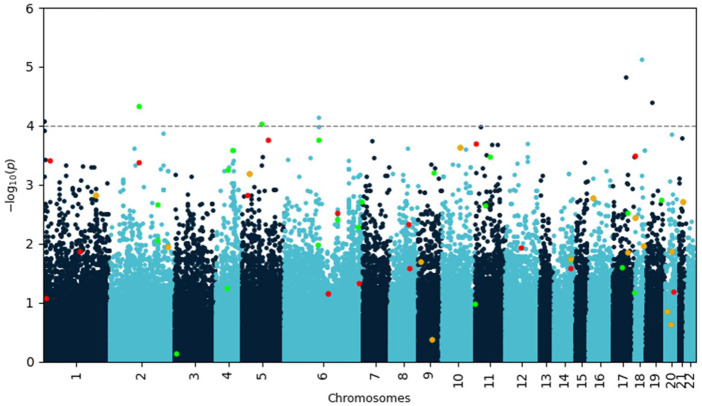
FIGURE 1.
Manhattan plot of negative decadic logarithm of p-values for SNPs as determined by SAIGE analysis. Variants identified by Lasso with feature selection are highlighted in red and green if they increase or decrease disease risk, respectively. Variants highlighted in orange occur in both protective and risk-enhancing groups of SNPs, depending on their genotype. Most of these biologically meaningful variants would have been missed by using a simple p-value cutoff.

