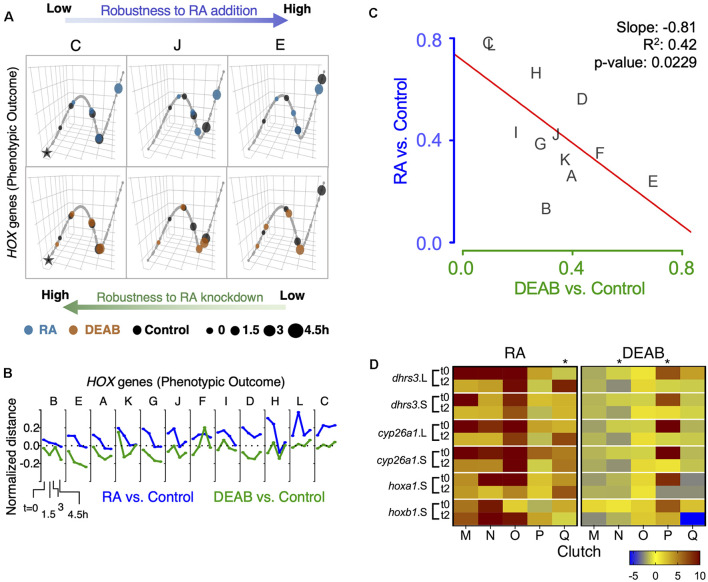
FIGURE 7.
Trajectory analysis to compare the extent of individual clutch robustness based on hox expression. (A) 3-dimensional principal curve for the hox genes, showing projections of the sample points on the curve for (A, top) RA and (A, bottom) DEAB treatments. Principal curves for clutches C, J, and E are shown. The black star indicates the beginning of the curve for the distance measurement along the trajectory. Ranking of clutches is based on the net (absolute) normalized distance of treatment samples from the corresponding control sample for each time point. (B) Normalized expression shift profile calculated from the principal curve as the arc distance between the treatment and the corresponding control. Clutches are rank-ordered from lowest to highest net expression shift for hox genes in the RA group. Clutches A-F data from RNA-seq, clutches G-L data from HT-qPCR. (C) Distribution of clutches based on the trajectory determined robustness to RA and DEAB treatments relative to each other based on hox expression. The letters indicate the distinct clutches. (D) Heat map representation of gene expression changes of five additional clutches transiently treated with RA or DEAB. Samples were analyzed at the end of the pulse (t0) and 2 h in the chase (t2). Asterisks denote clutches with abnormal responses.

