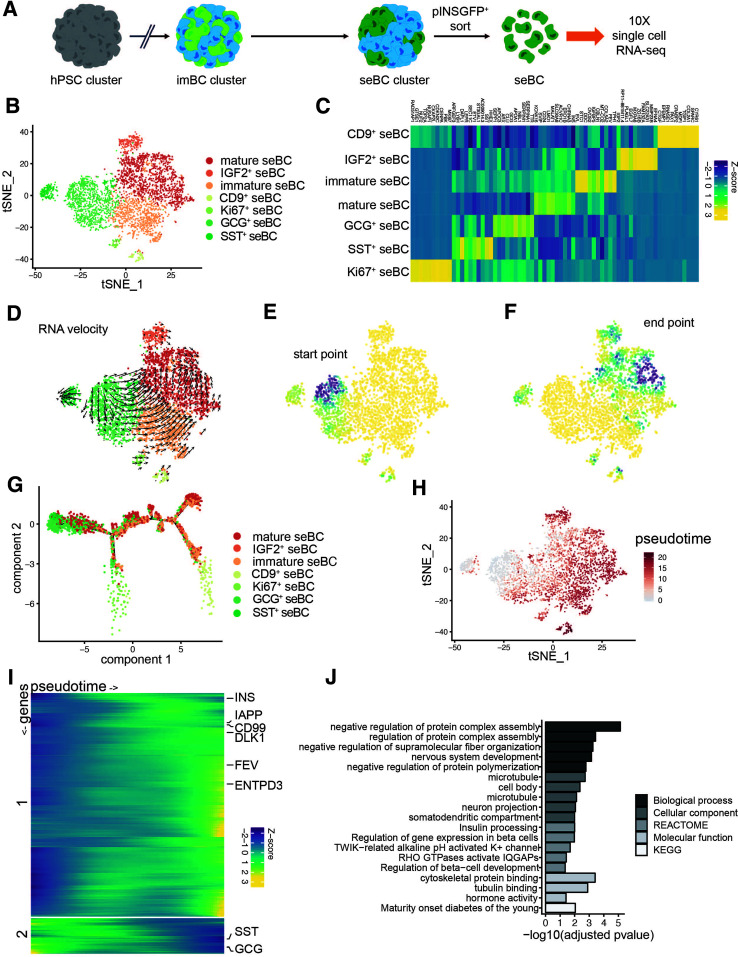
Figure 3.
scRNA-seq profiling of β-cell differentiation defines temporal dynamics of β-cell maturation. A: Schematic representation of seBC production and sorting. B: tSNE projection of 4,143 seBC. Cells are colored by inferred cell type based on marker gene expression. C: Heat map showing scaled abundance of the top 10 marker genes for each cell type identified by scRNA-seq analysis. D: tSNE projection with RNA velocity vector estimates overlaid. E and F: Differentiation start point (E) and end point (F) modeled using a Markov diffusion process on RNA velocity transmission probabilities. Start and end points were sampled from a uniform 100 × 100 grid and then imputed for all cells using K = 10 K-nearest neighbor pooling. Values range from 0 (yellow) to 1 (dark blue). G: Trajectory inference (monocle 2) analysis with cells colored by cell type. H: Pseudotime estimates overlaid on original tSNE projection. I: Heat map of scaled gene expression of genes with varying expression across pseudotime. Genes were clustered into two clusters with k-means clustering, and expression values were smoothed using cubic-spline interpolation. J: GO term enrichment analysis of marker genes of most mature seBC population identified by RNA velocity end point analysis (>0.8 end point density). hPSC, human pluripotent stem cell; KEGG, Kyoto Encyclopedia of Genes and Genomes.

