
Figure 4.
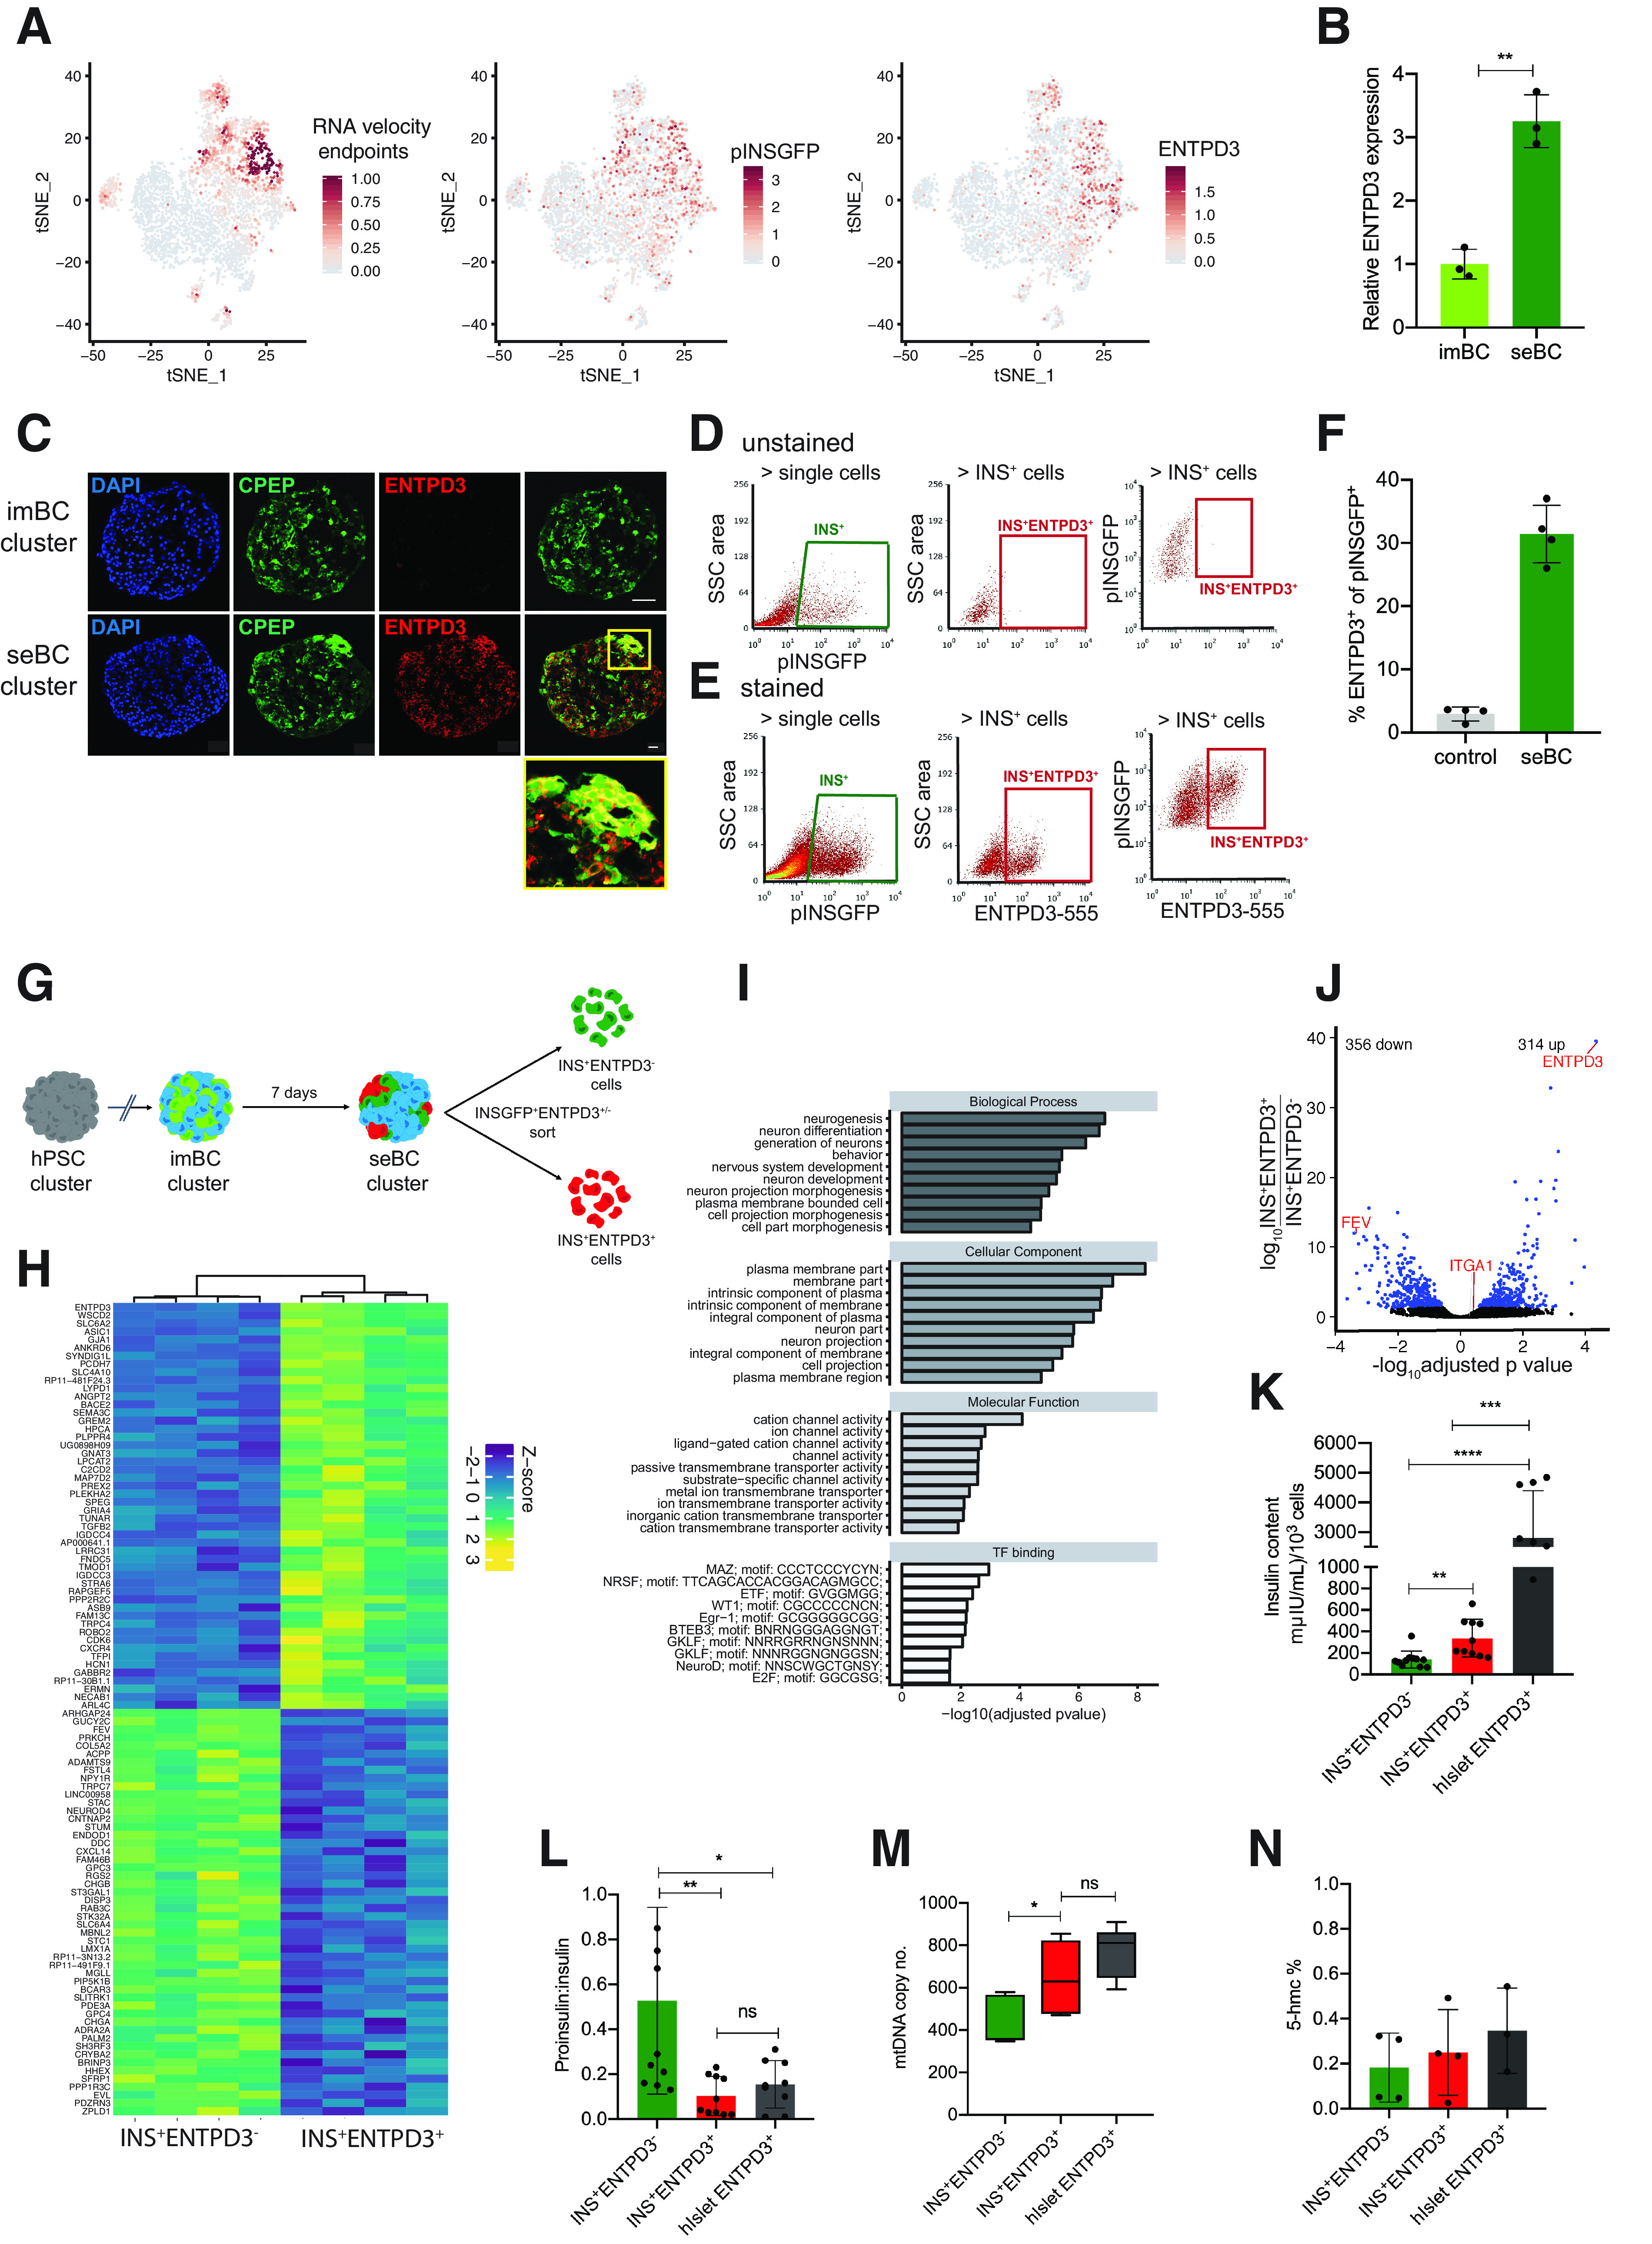
Ectonucleoside triphosphate diphosphohydrolase 3 marks mature β-like cells. A: tSNE projection of RNA velocity end points and pINSGFP transgene and ENTPD3 expression in 4,143 seBC. B: Relative ENTPD3 gene expression in pINSGFP+ imBC and seBC (n = 3 independent differentiation experiments). C: Immunofluorescence staining for C-peptide (CPEP) and ENTPD3 in sections of imBC and seBC clusters (scale bar represents 20 μm). D and E: Representative sorting gates for pINSGFP+ENTPD3+/− cells in unstained negative control cells (D) and with direct conjugated ENTPD3 antibody (E). F: Quantification of the percentage of ENTPD3+ cells within total pINSGFP+ population by FACS (n = 4 independent differentiation experiments). G: Schematic representation of pINSGFP+ENTPD3+/− sorting from seBC. H: Bulk RNA-seq analysis of INS+ENTPD3+ vs INS+ENTPD3− cells sorted from seBC clusters (uncurated list of top 30 genes significantly up- and down regulated as per adjusted P value <0.05; n = 4 independent differentiation experiments). I: GO term enrichment analysis of differentially expressed genes identified in bulk RNA seq. J: Volcano plot of differential expression analysis of INS+ENTPD3+ vs. INS+ENTPD3−. K: Insulin content per 1,000 INS+ENTPD3+/− sorted cells from seBC and human islets (n = 3 independent differentiation experiments or human islets preps, with 3 × 1,000 cells analyzed per experiment). L: Proinsulin-to-insulin content ratio of INS+ENTPD3+/− sorted cells from seBC and human islets (n = 3 independent differentiation experiments or human islets preps, with 3 × 1,000 cells analyzed per experiment). M: Quantitative PCR analysis of mtDNA normalized to gDNA in INS+ENTPD3+ vs. INS+ENTPD3− sorted cells from seBC and human islets; n = 3 independent differentiation experiments or human islets preps, with 3 × 500 cells analyzed per experiment). N: Global levels of 5-hmc in INS+ENTPD3+ vs. INS+ENTPD3− sorted cells from seBC day 30 and human islets (n = 4 independent differentiation experiments, with 1 × 500 cells analyzed per experiment). *P < 0.05; **P < 0.01; ***P < 0.001. Error bars are representative of the mean ± SD. ns, not significant.