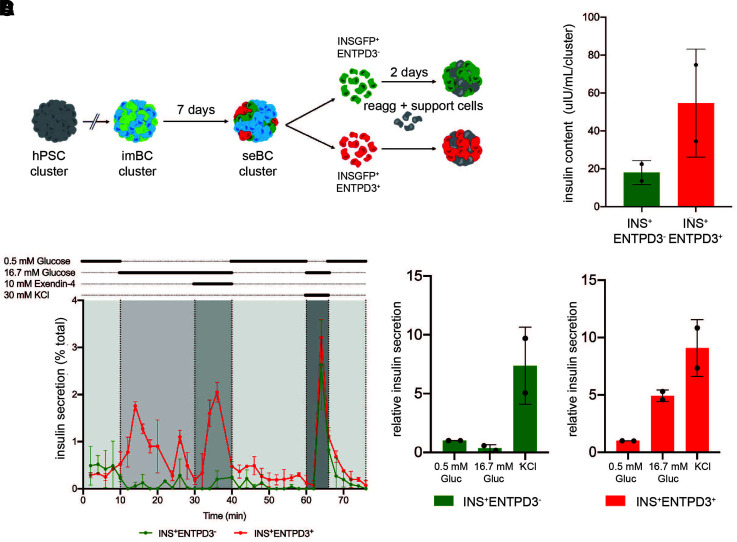
Figure 5.
INS+ENTPD3+ cells show improved function. A: Schematic representation of pINS+ENTPD3+/− cells sorted from seBC clusters reaggregated (reagg) in the presence of support cells, HUVEC, and mesenchymal stem cells for 48 h. B: Perifusion analysis of INS+ENTPD3− and INS+ENTPD3+ clusters; 20–25 clusters were analyzed per condition, and data are presented as % of total insulin in cluster pellet recovered (n = 2 independent differentiation experiments). C: Total insulin content of clusters recovered following perifusion analysis (n = 2 independent differentiation experiments). D: Relative insulin secretion during perifusion of INS+ENTPD3− and INS+ENTPD3+ clusters (n = 2 independent experiments) (data normalized to basal [0.5 mmol/L glucose] secretion). Gluc, glucose; hPSC, human pluripotent stem cell.

