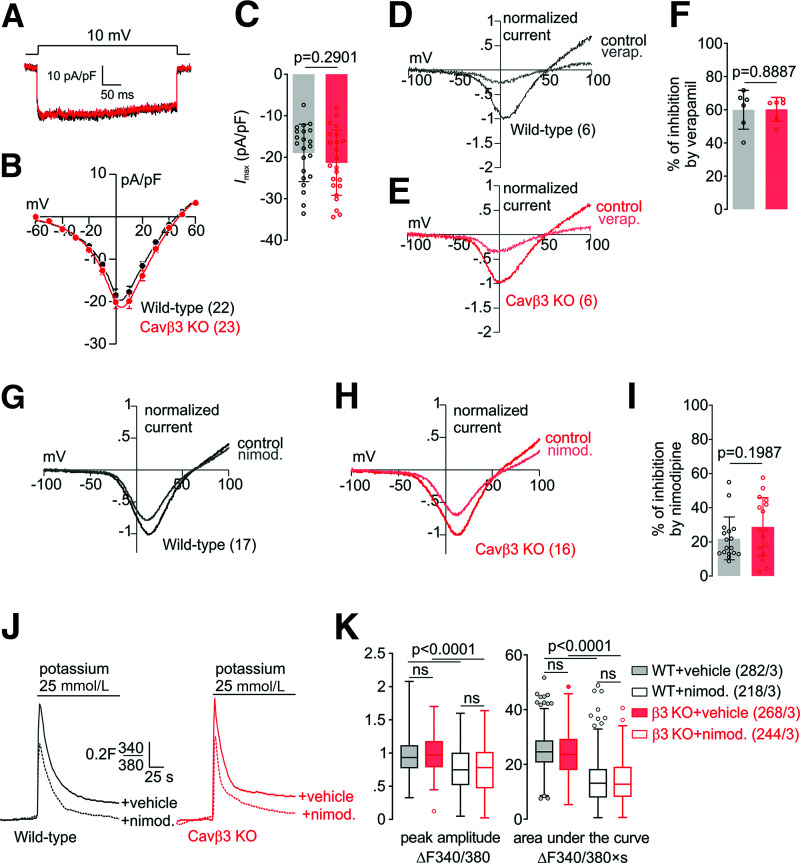
Figure 2.
Voltage-gated Ca2+ currents and Ca2+ entry in wild-type and Cavβ3-KO β-cells. A: Whole cell currents in wild-type (black) and Cavβ3-KO (red) cells during a voltage step from a holding potential of −60 mV to 10 mV plotted vs. time. B: Current-voltage relationship obtained by voltage steps (400 ms) applied every 2 s from a holding potential of −60 mV up to +60 mV with 10-mV increments, shown as mean ± SEM of the maximal current amplitudes extracted at each voltage step. C: Maximal current amplitude (Imax) at 10 mV shown as single values (dot) and bar graph with mean ± SD. The number of cells included in the analysis is shown in B. Current-voltage relationships from wild-type (D) and Cavβ3-KO β-cells (E) obtained by 50-ms voltage ramps from −100 mV to +100 mV applied every 2 s from a holding potential of −60 mV before (control) and after the application of verapamil (verap.; 10 μmol/L) as indicated. F: Percentage of the Cav-current inhibition after application of verapamil analyzed from experiments in D and E. The number of cells included in the analysis are shown in D and E. Current-voltage relationships from wild-type (G) and Cavβ3-KO β-cells (H) obtained by 50-ms voltage ramps from −100 mV to +100 mV applied every 2 s from a holding potential of −60 mV before (control) and after the application of nimodipine (nimod.; 2 μmol/L) as indicated. I: Percentage of the Cav-current inhibition after application of nimodipine analyzed from experiments in G and H. Data in F and I are shown as single values and bar graph with mean ± SD, with the indicated P values calculated by unpaired two-tailed Student t test. J: Mean Fura-2 (F340/F380) ratiometric traces in the presence of 2 mmol/L extracellular Ca2+ before and after addition of 25 mmol/L potassium in wild-type (black) and Cavβ3-KO (red) cells. Cells were pretreated with 2 μmol/L nimodipine (+nimod., dashed lines) or vehicle (+vehicle, solid lines) for 10 min, and nimodipine was maintained during the whole experiment. K: Peak amplitude and the area under the curve of the potassium-induced Ca2+-influx, shown as Tukey box and whiskers, with the boxes extending from the 25th to the 75th percentile and the line inside the box shows the median. The interquartile ranges represent the difference between the 25th and 75th percentiles. Whiskers are extended to the most extreme data point that is no more than 1.5 times the interquartile range from the edge of the box, and outliers beyond the whiskers are depicted as dots. The indicated P values were calculated by Kruskal–Wallis with Dunn multiple-comparisons test, and the number of measured cells (x) per experiment (y) are indicated as (x/y).

