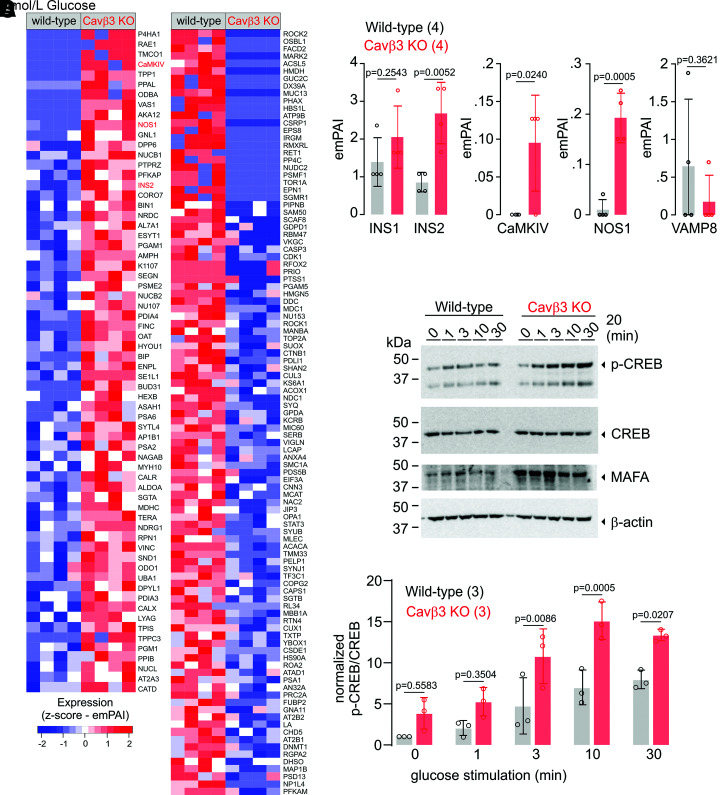
Figure 4.
Protein profiling of pancreatic β-cells in the presence (wild-type) and absence (KO) of Cavβ3. A: Protein abundances identified by mass spectrometry, upregulated (66 proteins, left panel) and downregulated (103 proteins, right panel) in Cavβ3-KO compared with the wild-type β-cells (identified based on the emPAI values with a P value <0.05, calculated by unpaired two-tailed Student t test) (n = 4: three biological replicates and one technical replicate). B: Protein levels of INS1, INS2, CaMKIV, NOS1, and VAMP8 shown as single emPAI values and bar graphs with mean ± SD, with the indicated P values calculated by unpaired two-tailed Student t test. C: Western blot of protein extracts from wild-type and Cavβ3-KO cells (50 µg protein/lane) using specific antibodies against the phosphorylated form of CREB (p-CREB), total CREB, MAFA, and β-actin as indicated. Cells were stimulated with KRBH buffer containing 20 mmol/L glucose for 1, 3, 10, and 30 min or left untreated (0). D: Densitometric quantification of the antibody stain showing the p-CREB/CREB ratio obtained from three Western blots running protein lysates obtained from independent β-cell cultures. Data are shown as single values and bar graphs with mean ± SD, with the indicated P values calculated using two-way ANOVA followed by Bonferroni multiple-comparison test.

