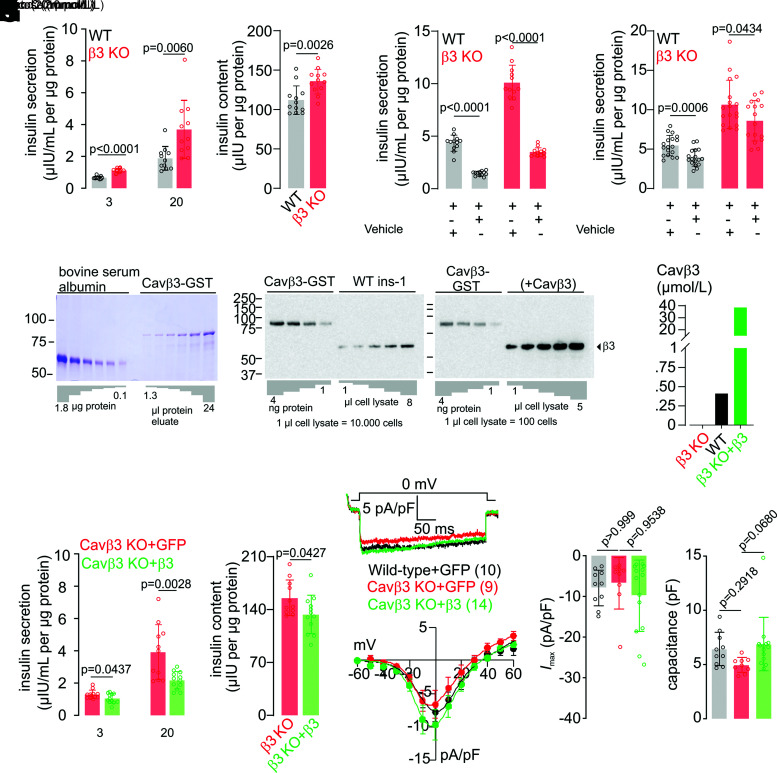
Figure 5.
The Cavβ3 protein decreases insulin secretion in a dose-dependent manner without affecting the Cav channel function. Glucose-dependent (3 mmol/L and 20 mmol/L) insulin secretion (A) and total insulin content (B) normalized to total cellular protein content measured from wild-type (WT; black) and Cavβ3-KO (β3 KO; red) β-cells shown as single values and bar graphs with mean ± SD, with the indicated P values calculated by unpaired two-tailed Student t test. Insulin secretion normalized to total cellular protein content measured from wild-type (black) and Cavβ3-KO (red) β-cells exposed to 20 mmol/L glucose (Gluc.) in the absence or presence of nimodipine (Nimod.; 2 μmol/L) (C) or xestospongin C (Xest. C; 10 μmol/L) (D). Data are shown as single values and bar graphs with mean ± SD, with the indicated P values calculated by unpaired two-tailed Student t test. E: Estimation of the Cavβ3 protein concentration in β-cells. The concentration of recombinant GST-Cavβ3 was determined by densitometric analysis relative to the known concentrations of BSA (left) in Coomassie-stained SDS-PAGE. Immunostain intensities obtained from anti-Cavβ3 Western blots from known amounts of recombinant GST-Cavβ3 protein (1, 2, 3, and 4 ng) were compared with endogenous Cavβ3 protein of a defined number of wild-type β-cells (middle) and Cavβ3-KO β-cells transfected with the Cacnb3 cDNA (+Cavβ3, right). Transfected cells were identified by their green fluorescence and sorted by preparative FACS before analyses. Cavβ3 is estimated at 36.8 fg/single wild-type β-cell and 3.4 pg/single Cavβ3-cDNA–expressing cell. F: Considering the β-cell volume of 1.6 pL, Cavβ3 protein concentrations were calculated as 0.41 μmol/L in wild-type cells and as 38.6 μmol/L per cell after transfection with the Cavβ3 cDNA. Glucose-dependent (3 mmol/L and 20 mmol/L) insulin secretion (G) and total insulin content (H) normalized to total cellular protein content measured from Cavβ3-KO cells transfected with either IRES-GFP (Cavβ3 KO+GFP; red) or Cavβ3-IRES-GFP (Cavβ3 KO+β3; green) cDNA shown as single values and bar graphs with mean ± SD, with the indicated P values calculated by unpaired two-tailed Student t test. Note: insulin release and content are overestimated in β3 KO+β3 cells, a mixture of transfected and nontransfected cells. I: Whole cell currents during voltage steps from a holding potential of −60 mV to 0 mV plotted vs. time recorded from wild-type cells (black, transfected with IRES-GFP as a control) or Cavβ3-KO cells transfected with IRES-GFP (red) or with Cavβ3-IRES-GFP (green). J: Current-voltage relationships obtained by voltage steps (400 ms) applied every 2 s from a holding potential of −60 mV up to +60 mV with 10-mV increments shown as mean ± SEM of the maximal current amplitudes extracted at each voltage step. K and L: Maximal current amplitude (Imax) at 0 mV and cell capacitance shown as single values and bar graphs with mean ± SD, with the indicated P values calculated by one-way ANOVA followed by Bonferroni multiple-comparison test. The number of cells analyzed in I–L is indicated in I.

