Figure 6.
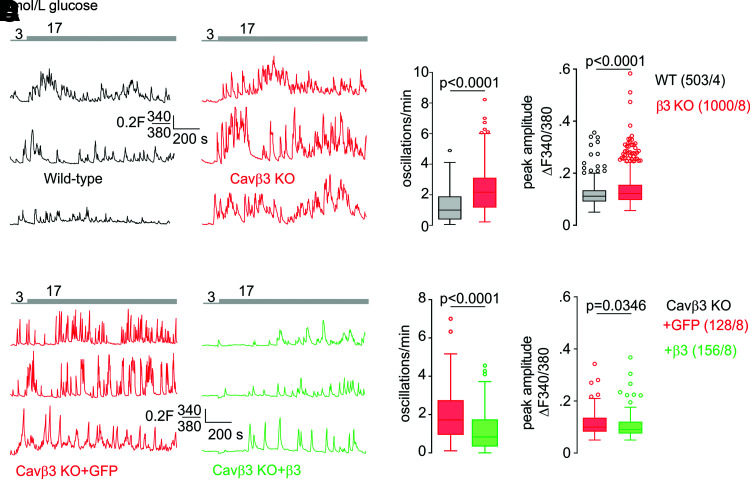
Cavβ3 inhibits frequency of glucose-induced Ca2+ oscillations. Representative Fura-2 (F340/380) ratiometric traces in the presence of extracellular Ca2+ from wild-type (WT; black) and Cavβ3-KO (red) β-cells (A) or from Cavβ3-KO β-cells transfected with either IRES-GFP (red) or Cavβ3-IRES-GFP (green) (C) in the presence of 3 mmol/L and 17 mmol/L extracellular glucose as indicated. B and D: Numbers of glucose-evoked Ca2+ oscillations per minute (left) and mean peak amplitude per cell (right) from experiments in A and C. Data in B and D are shown as Tukey box and whiskers with the boxes extending from the 25th to the 75th percentile, and the line inside the box shows the median. The interquartile ranges represent the difference between the 25th and 75th percentiles. Whiskers are extended to the most extreme data point that is no more than 1.5 times the interquartile range from the edge of the box, and outliers beyond the whiskers are depicted as dots. The indicated P values were calculated by Mann-Whitney test, and the number of measured cells (x) per experiment (y) are indicated as (x/y).

