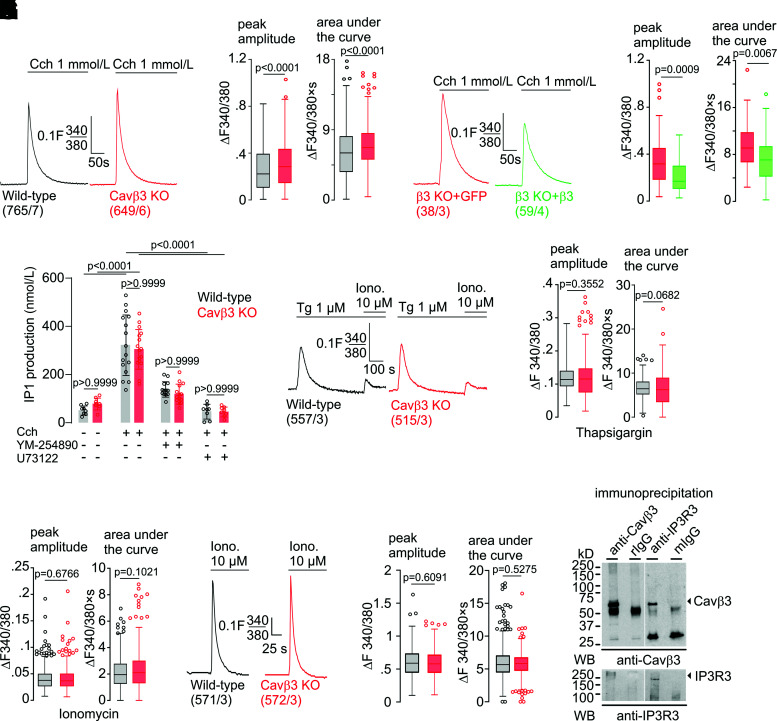
Figure 7.
Cavβ3 binds to the IP3 receptor and inhibits IP3-dependent Ca2+ release. Mean Fura-2 (F340/380) ratiometric traces in the absence of extracellular Ca2+ from wild-type (black) and Cavβ3-KO β-cells (red) (A) and from Cavβ3-KO β-cells transfected with either IRES-GFP (red) or Cavβ3-IRES-GFP (green) (C) before and after application of carbachol (Cch; 1 mmol/L). B and D: Peak amplitude (left) and the area under the curve (right) of carbachol-evoked Ca2+ signals from experiments shown in A and C. E: IP3 production as measured by the accumulation of IP1 (in nanomoles per liter) in wild-type (black) and Cavβ3-KO β-cells (red) in response to carbachol stimulation in the absence or presence of the Gαq/11-specific inhibitor YM-254890 (100 nmol/L) or the phospholipase C inhibitor U73122 (10 μmol/L). Data are shown as single values and bar graphs with mean ± SD, with the indicated P values calculated by one-way ANOVA followed by Bonferroni multiple-comparison test. F: Mean Fura-2 (F340/380) ratiometric traces in the absence of extracellular Ca2+ from wild-type (black) and Cavβ3-KO (red) β-cells before and after application of thapsigargin (Tg; 1 μmol/L) and then ionomycin (Iono.; 10 μmol/L). Peak amplitude (left) and area under the curve (right) of thapsigargin (G) and ionomycin-evoked (H) Ca2+ signal. I: Mean Fura-2 (F340/380) ratiometric traces in the absence of extracellular Ca2+ from wild-type (black) and Cavβ3-KO (red) β-cells before and after application of ionomycin (10 μmol/L). J: Peak amplitude and area under the curve of ionomycin-evoked Ca2+ signal. Data in B, D, G, H, and J are shown as Tukey box and whiskers with the boxes extend from the 25th to the 75th percentile, and the line inside the box shows the median. The interquartile ranges represent the difference between the 25th and 75th percentiles. Whiskers are extended to the most extreme data point that is no more than 1.5 times the interquartile range from the edge of the box, and outliers beyond the whiskers are depicted as dots. The indicated P values were calculated by Mann-Whitney test, and the number of measured cells (x) per experiment (y) are indicated as (x/y). K: Coimmunoprecipitation of Cavβ3 and the IP3R3. Immunoprecipitations were performed with antibodies against Cavβ3, nonspecific rabbit Ig (rIgG), anti-IP3R3, and nonspecific mouse Ig (mIgG). Eluted protein complexes were subjected to Western blot (WB) using anti-Cavβ3 (top blot) and anti-IP3R3 (bottom blot).

